
Every utility, and the operational drivers behind it.
Consumption alone doesn't explain anything. HEP holds the operational context alongside it, which is what makes normalisation and regression possible.
Utilities
Operational drivers
Portfolios spanning countries and currencies are handled natively — HEP is multi-property and multi-currency, and applies emission factors yearly per location.
No re-templating every property.
Once the system is set up, raw daily and monthly data uploads through Excel connectors that map to the sheets each hotel already maintains.
- Excel connectors that attach to any existing hotel spreadsheet.
- Climatic data updated automatically, daily — cooling and heating degree days, so normalisation needs no manual input.
- Structured import streams for each type of data, each on its own cycle.
- SaaS — accessible from any browser, anytime, with no local installation.
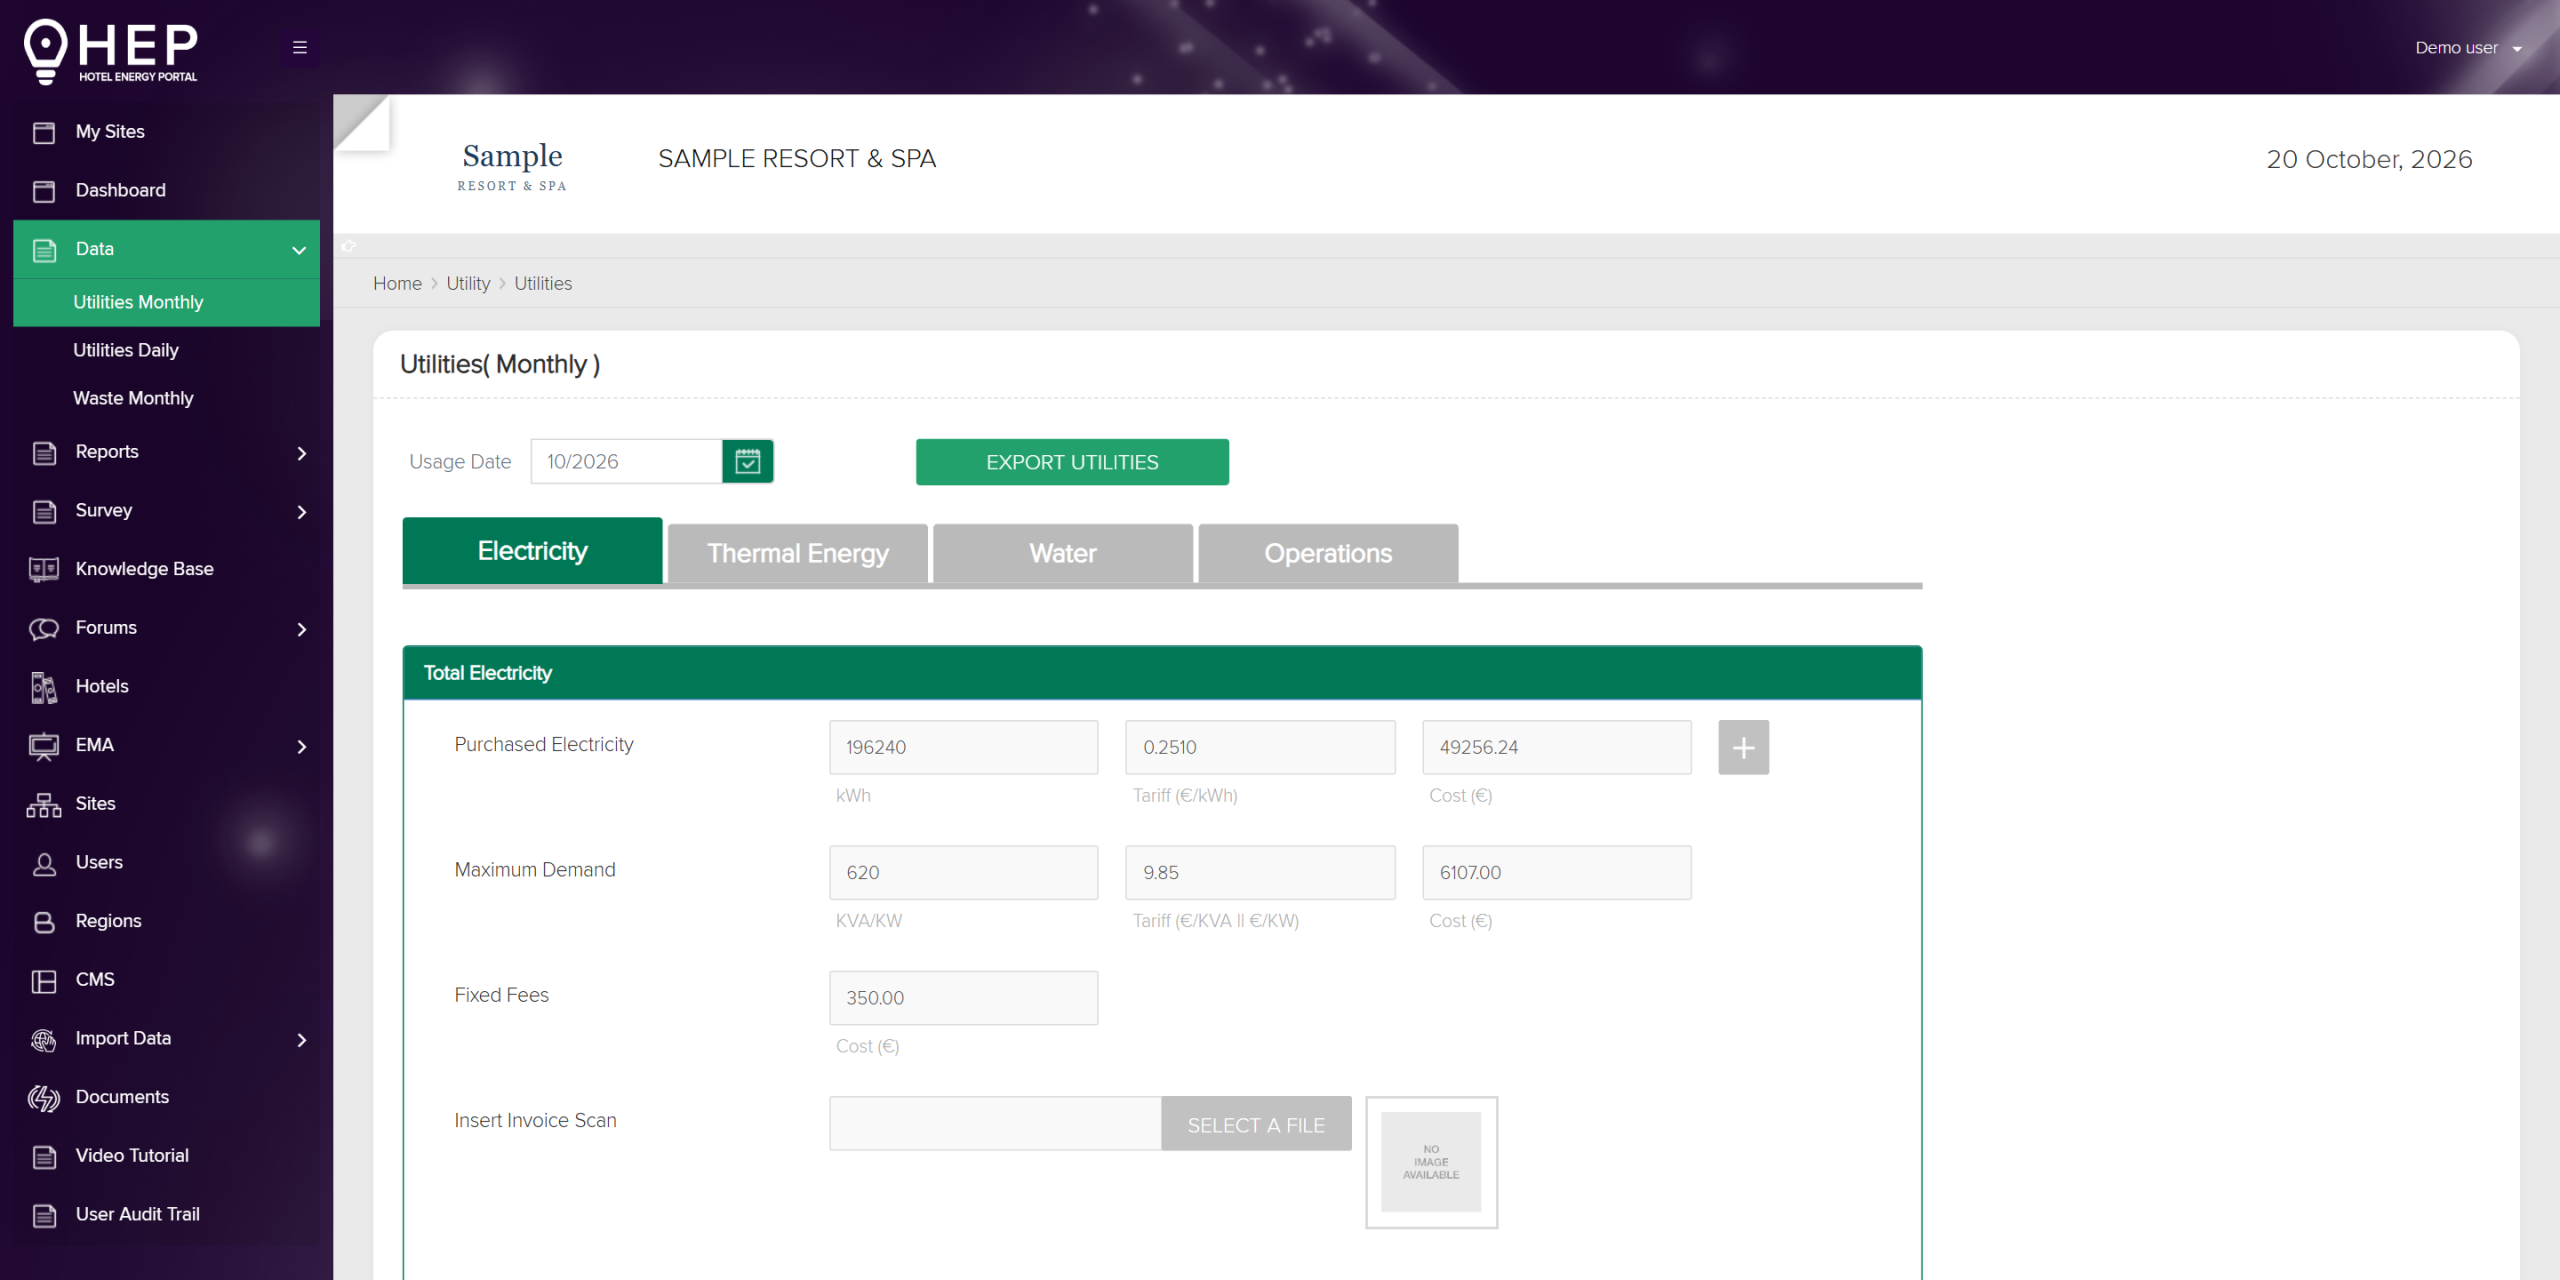
Five structured streams.
| Stream | What it covers | Cycle |
|---|---|---|
| Utilities Monthly | Monthly consumption and cost for every utility at the property, with occupancy and room nights. | Monthly |
| Utilities Daily | Daily readings for main meters and submeters, feeding month-to-date views and daily trends. | Daily |
| Waste Monthly | Waste by stream, with volumes and cost, in the same cycle as utilities. | Monthly |
| Emission Factors Yearly | Grid and fuel emission factors per location, so carbon reflects the right country. | Yearly |
| Survey Import | Sustainability and ESG survey responses and supporting evidence. | As scheduled |
Nothing gets forgotten.
The hardest part of group reporting is not the analysis — it's getting fourteen properties to submit on time. HEP does the chasing.
Missing upload alerts
Properties that have not uploaded their utilities data or supporting documents are flagged automatically, and the responsible users are notified.
Last-uploaded status
Every stream shows when it last received data, per property, visible on the dashboard rather than buried in a report.
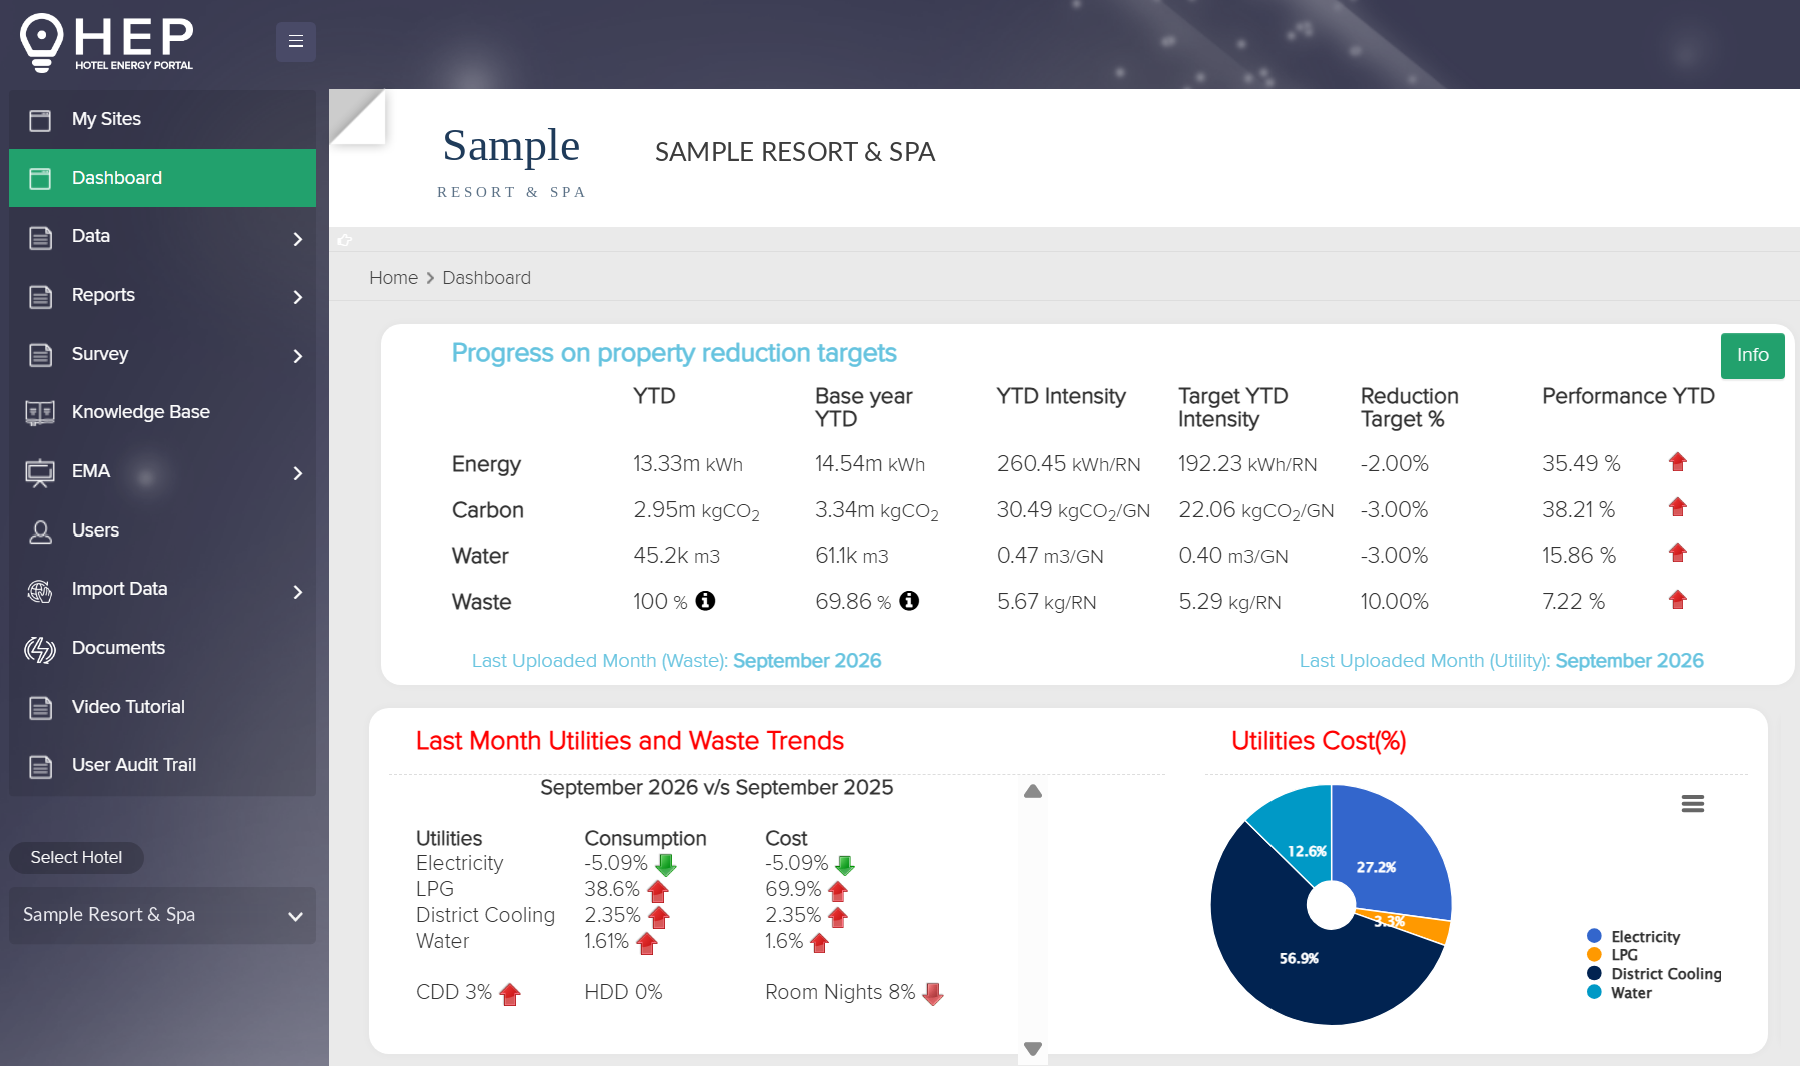
The whole property on one screen.
What a general manager or engineering director sees on opening the portal.
- Progress against reduction targets — consumption and intensity year to date, against target, with performance YTD.
- Utilities cost across the current month, the previous month and the same month last year.
- Cost versus budget for the month and year to date.
- Last month's trends by utility, with CDD, HDD and room nights beside them.
- Cost split by utility and a notifications panel for the property.
About getting data in
Do our properties need automated metering?
No. HEP makes use of the existing infrastructure and practices of hotels. Raw daily and monthly data uploads through Excel connectors that attach to the sheets each property already keeps. The IoT module, which enables real-time acquisition from meters and equipment, is entirely optional.
Which utilities can we track?
Electricity, water, LPG, fuel oil, gas and district cooling, alongside waste, cost, occupancy, room nights, and cooling and heating degree days for normalisation. Submetering is unlimited on any utility.
Is HEP installed on our servers?
No. HEP is a SaaS platform, accessible from any browser, anytime.
See your own data in HEP.
Send us one property's utility history and we will build a live site from it.
Request a demo