
Optimized operations. Verified sustainability.
HEP is a hospitality-driven platform that centralises your property data and gives hotel groups a strategic, data-driven approach to sustainability and efficiency. Daily utility tracking, submetering and cost control on one side; science-based targets, carbon, waste and ESG on the other — built on the same validated dataset, so the two never disagree.
What HEP actually does, in three minutes.
From the daily complexity of hotel operation through to carbon, waste, ESG and the efficiency measures that move the numbers.
What you'll see
- The operational challengeGuest rooms, kitchens, laundry, HVAC and pools, scattered across bills and spreadsheets.
- Centralised utility trackingEvery utility, cost, occupancy and room night in one place.
- Targets and benchmarkingScience-based targets for energy, waste and carbon, and CHSB positioning.
- Sustainability and carbonCarbon accounting, waste tracking and the ESG survey.
- Efficiency measuresKnowledgebase, action plans and implementation tracking.
Hotel groups are driven by more than managing costs.
Brand reputation, growing regulatory demands and ambitious sustainability targets now sit alongside utility cost. Navigating that needs a unified, strategic approach to environmental and social impact across entire portfolios.
Brand expectations
Guests, corporate clients and OTAs increasingly ask what a property is doing — and expect an answer backed by numbers.
Regulatory demands
Reporting obligations keep widening, and the data behind them has to survive scrutiny rather than be assembled at the deadline.
Sustainability goals
Group-level commitments on energy, carbon, water and waste have to become something each property can actually act on.
Competitive edge
Lower consumption is lower cost. The properties that measure properly find savings the others never see.
But a sustainability target is only as good as the data behind it.
Every room night, kitchen service, laundry cycle and HVAC load affects consumption, cost and environmental performance. In most groups that information arrives too late and in too many shapes to be useful.
The data is scattered
Utility bills, meter readings, Excel sheets and separate department inputs — each in a different format, each arriving at a different time.
More processing than analysis
Teams spend the month rebuilding numbers instead of interpreting them. By the time the report is ready, the consumption is already spent.
Properties act as islands
Efficiency projects run property by property with no shared catalogue, no visibility of who is doing what, and no way to compare results.
Two halves of the same system.
Operational tracking is the foundation and sustainability performance is what it produces — but neither is a side effect of the other. They are given equal weight in the portal, and on this site.
Understand how the building actually behaves
Daily and monthly tracking of every utility and submeter, with the operational drivers beside them — so a change in consumption can be explained rather than guessed at.
- Electricity, water, LPG, fuel, gas, district cooling
- Cost, occupancy, room nights, CDD and HDD
- Unlimited submeters, configured per property
- Regression analysis against a chosen baseline year
- 110 distinct views and exports and automatic dispatch
Turn that behaviour into a reportable result
Science-based targets, carbon accounting, waste tracking and the ESG survey — all drawn from the same validated data, so the sustainability report and the utility report cannot disagree.
- Science-based targets for energy, carbon, water and waste
- Carbon from your own consumption, factors applied per location
- Waste captured monthly, in the same cycle as utilities
- ESG survey across eight topics, with evidence
- Cornell CHSB benchmarking against the peer set
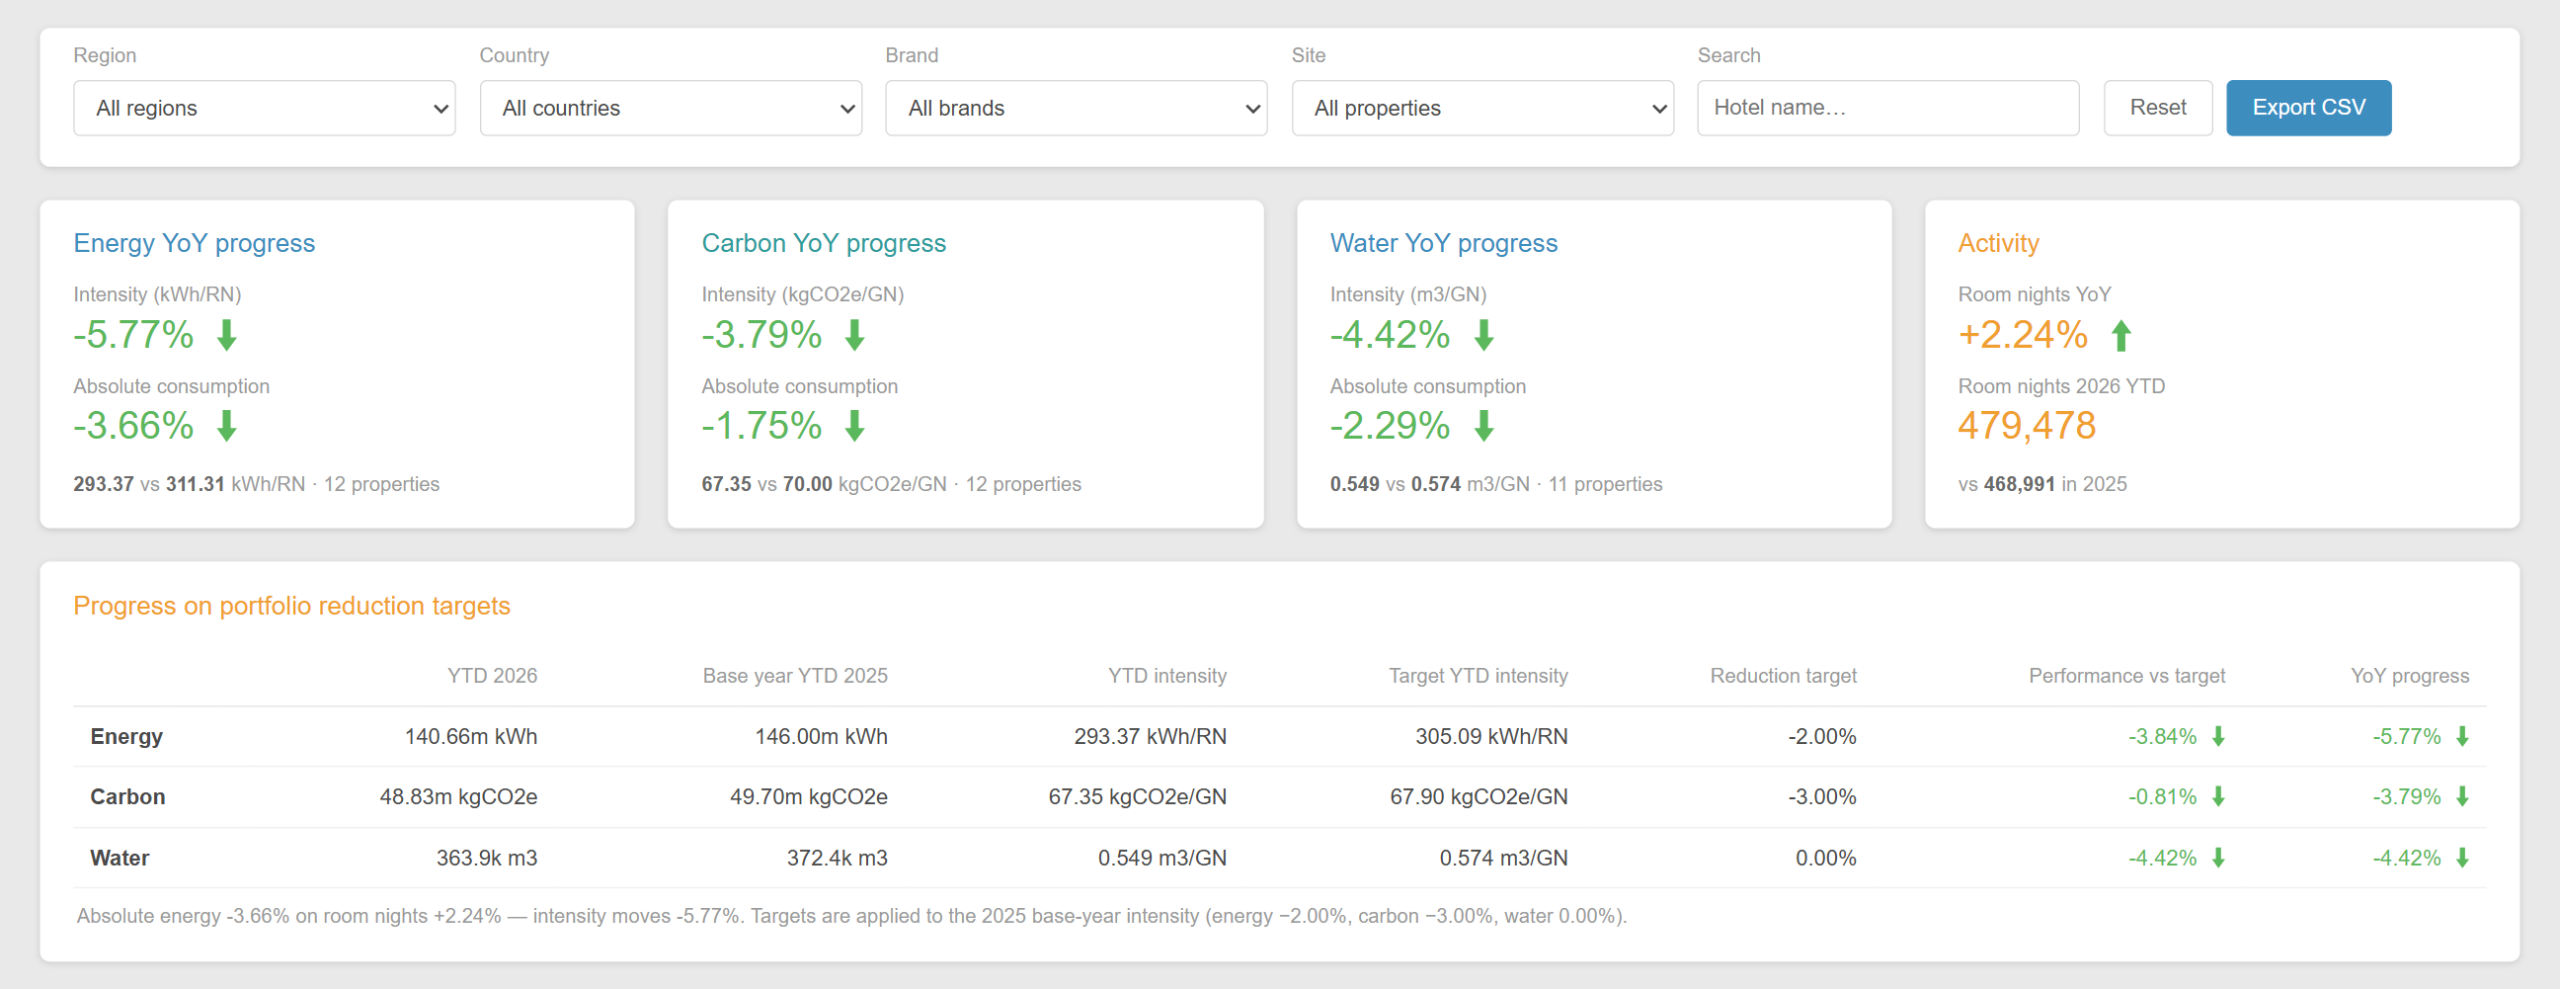
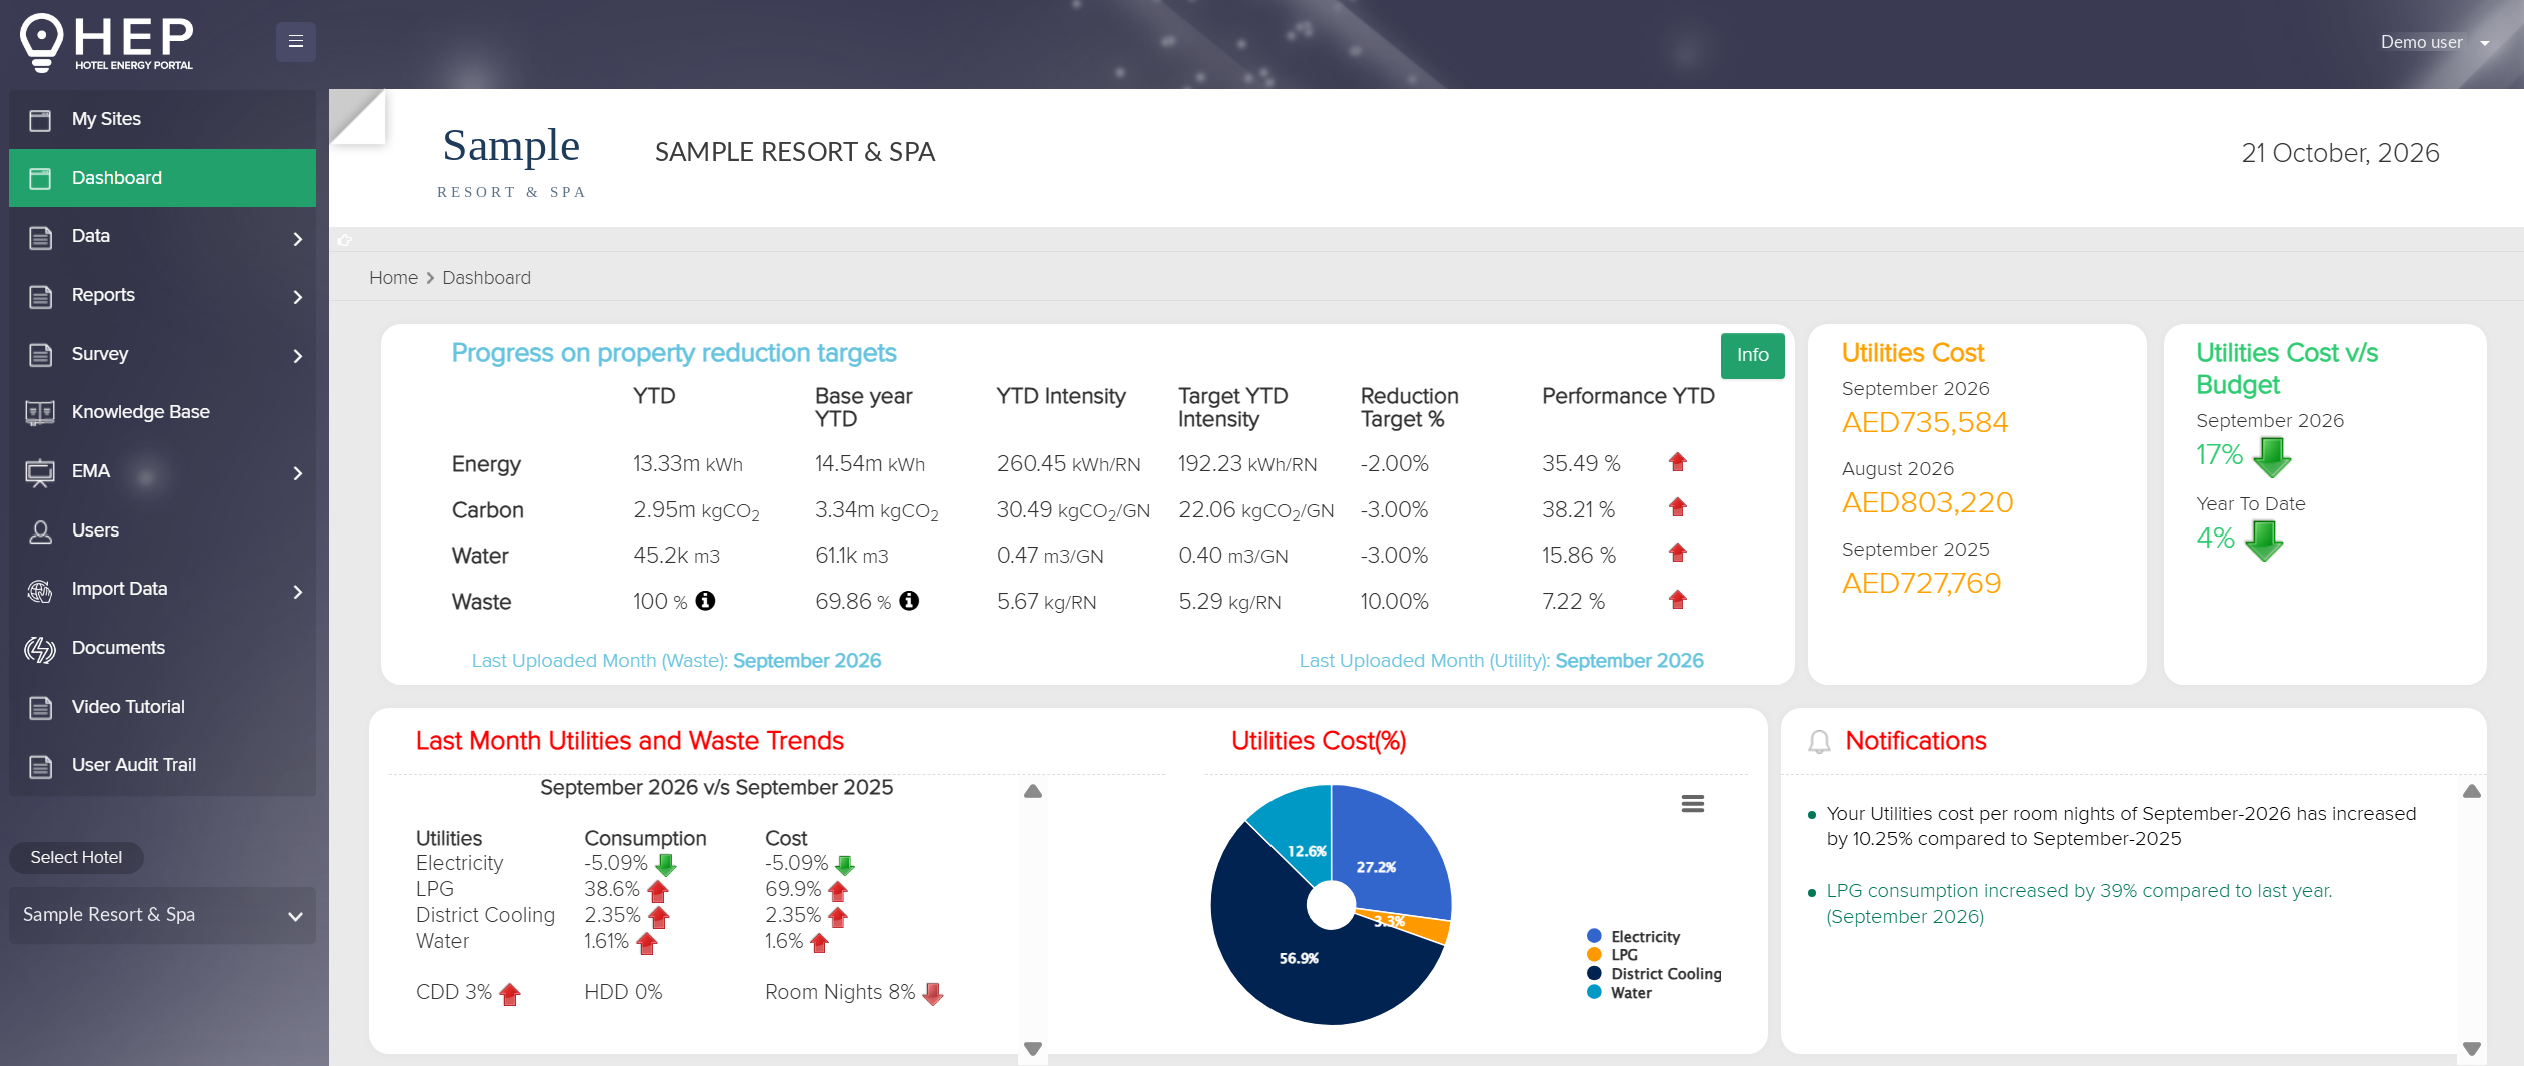
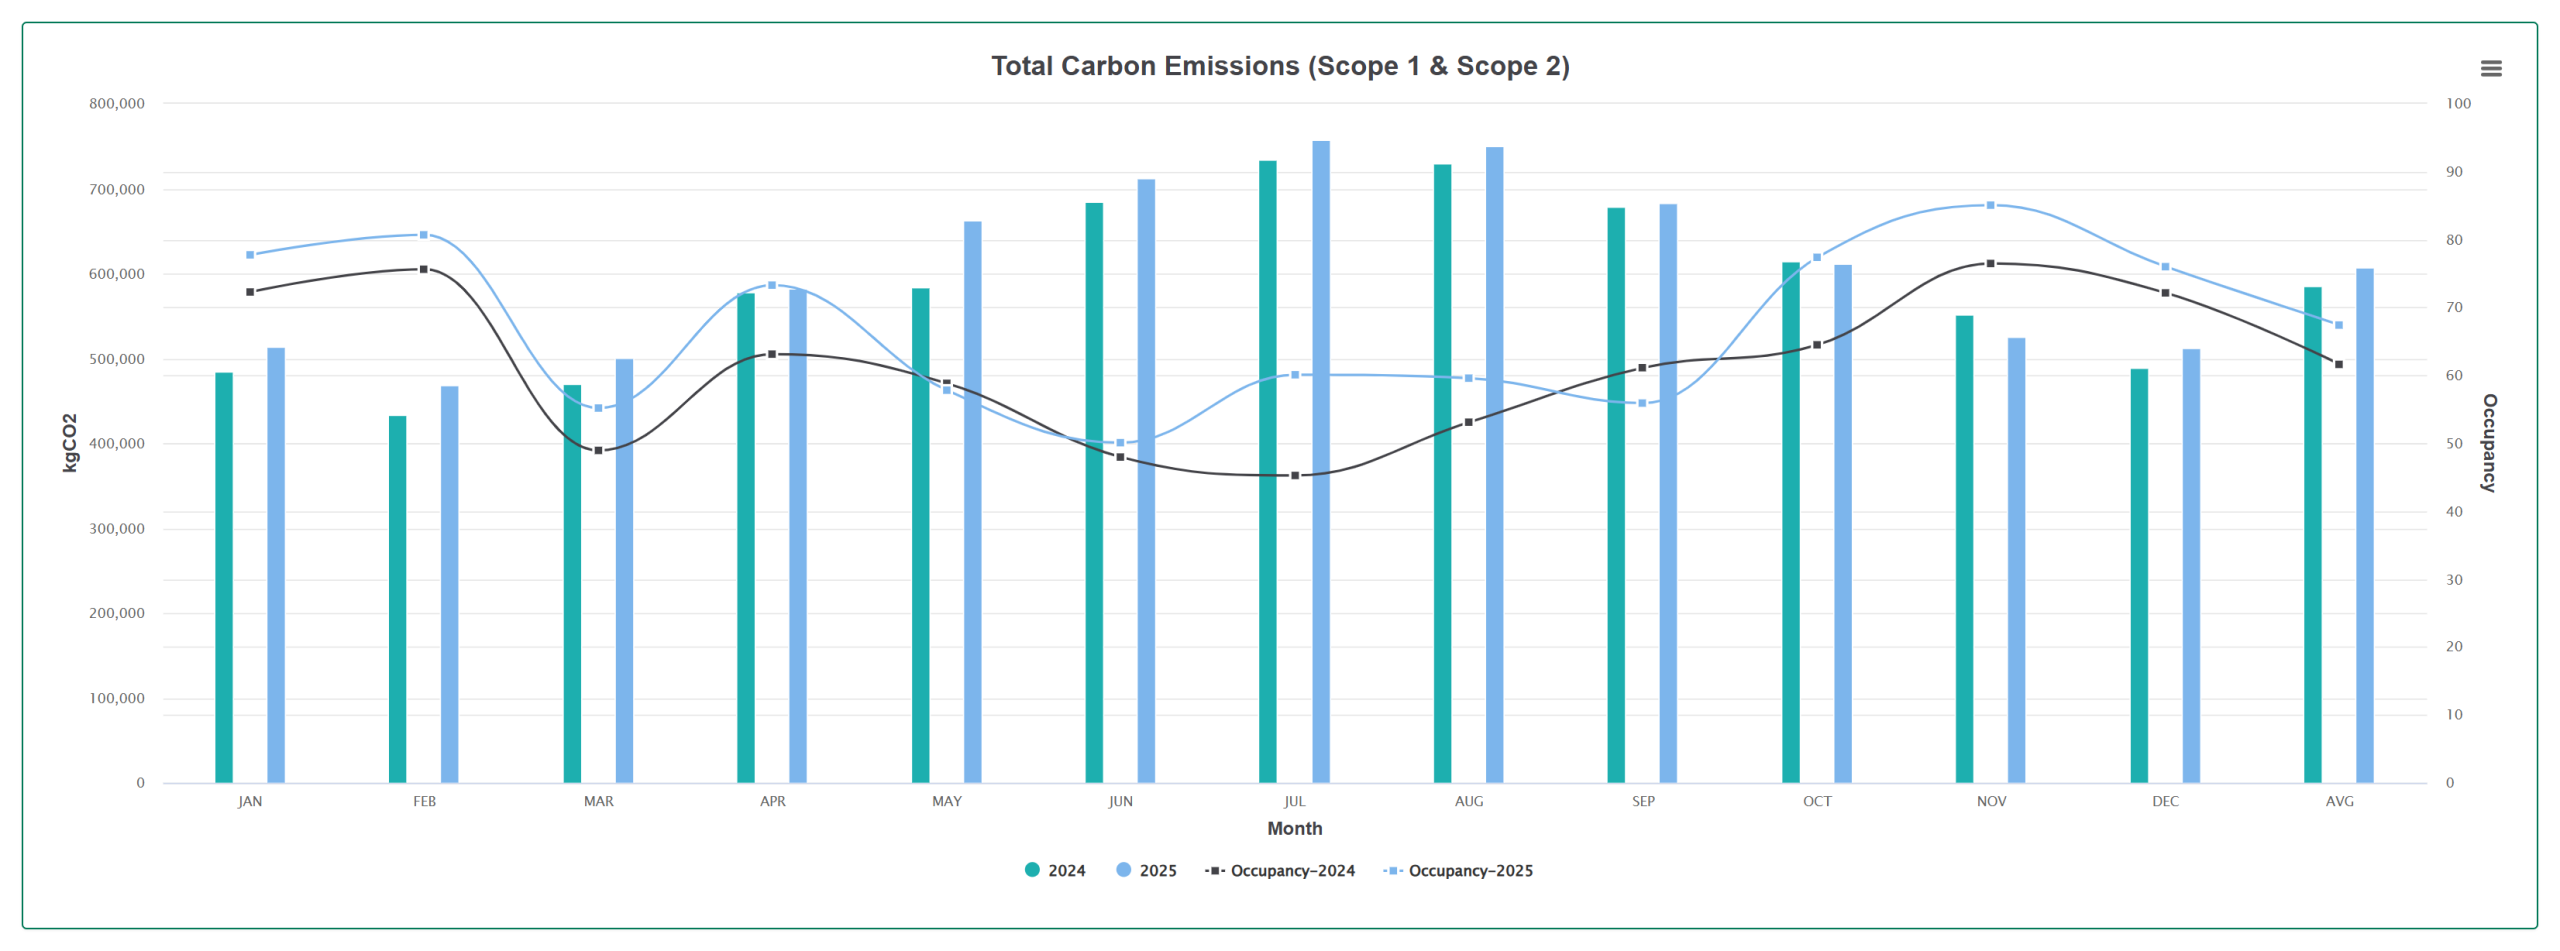
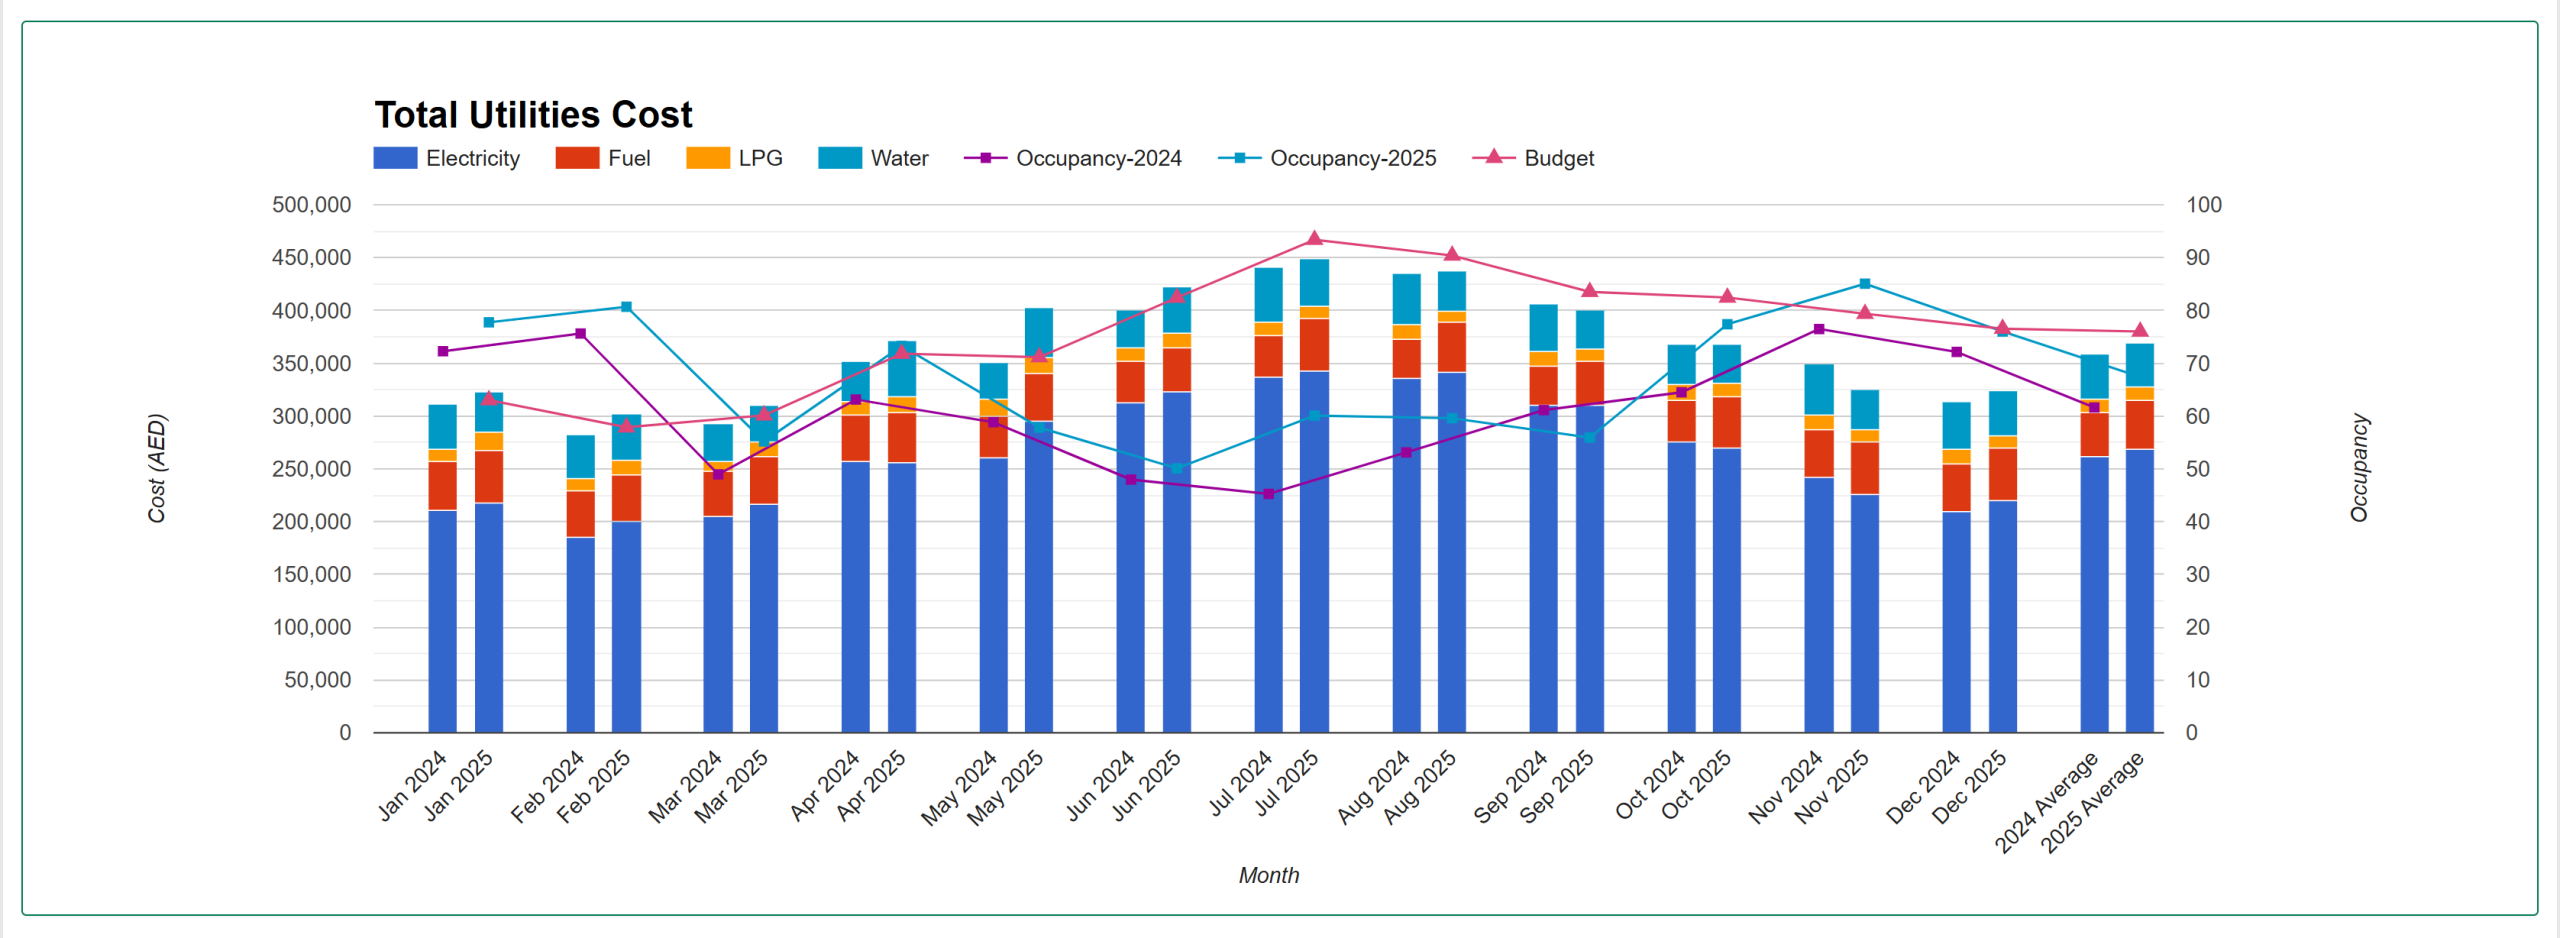
Real screens, not illustrations.
Six screens here; the full gallery lives on the platform overview.
Everything in one portal.
Every module below exists in HEP today. Follow any card for the detail.
Utilities tracking
All utilities and submeters, daily and monthly, centrally managed.
- Electricity, water, LPG, fuel, gas, district cooling
- Cost, occupancy, room nights, CDD and HDD
- Multi-property, multi-currency
Targeting & benchmarking
Science-based targets, tracked continuously and benchmarked externally.
- Targets for energy, carbon, water and waste
- Cornell CHSB benchmarking
- Comparative analysis within the group
Utilities & carbon reporting
110 configurable reports across hotel, group and month-to-date views.
- 10+ total utilities reports
- 70+ custom reports per utility
- Carbon and waste indicators included
Carbon, waste & ESG
Sustainability reporting drawn from the same operational dataset.
- Carbon from your own consumption
- Waste Monthly capture and segregation
- ESG survey across eight topics
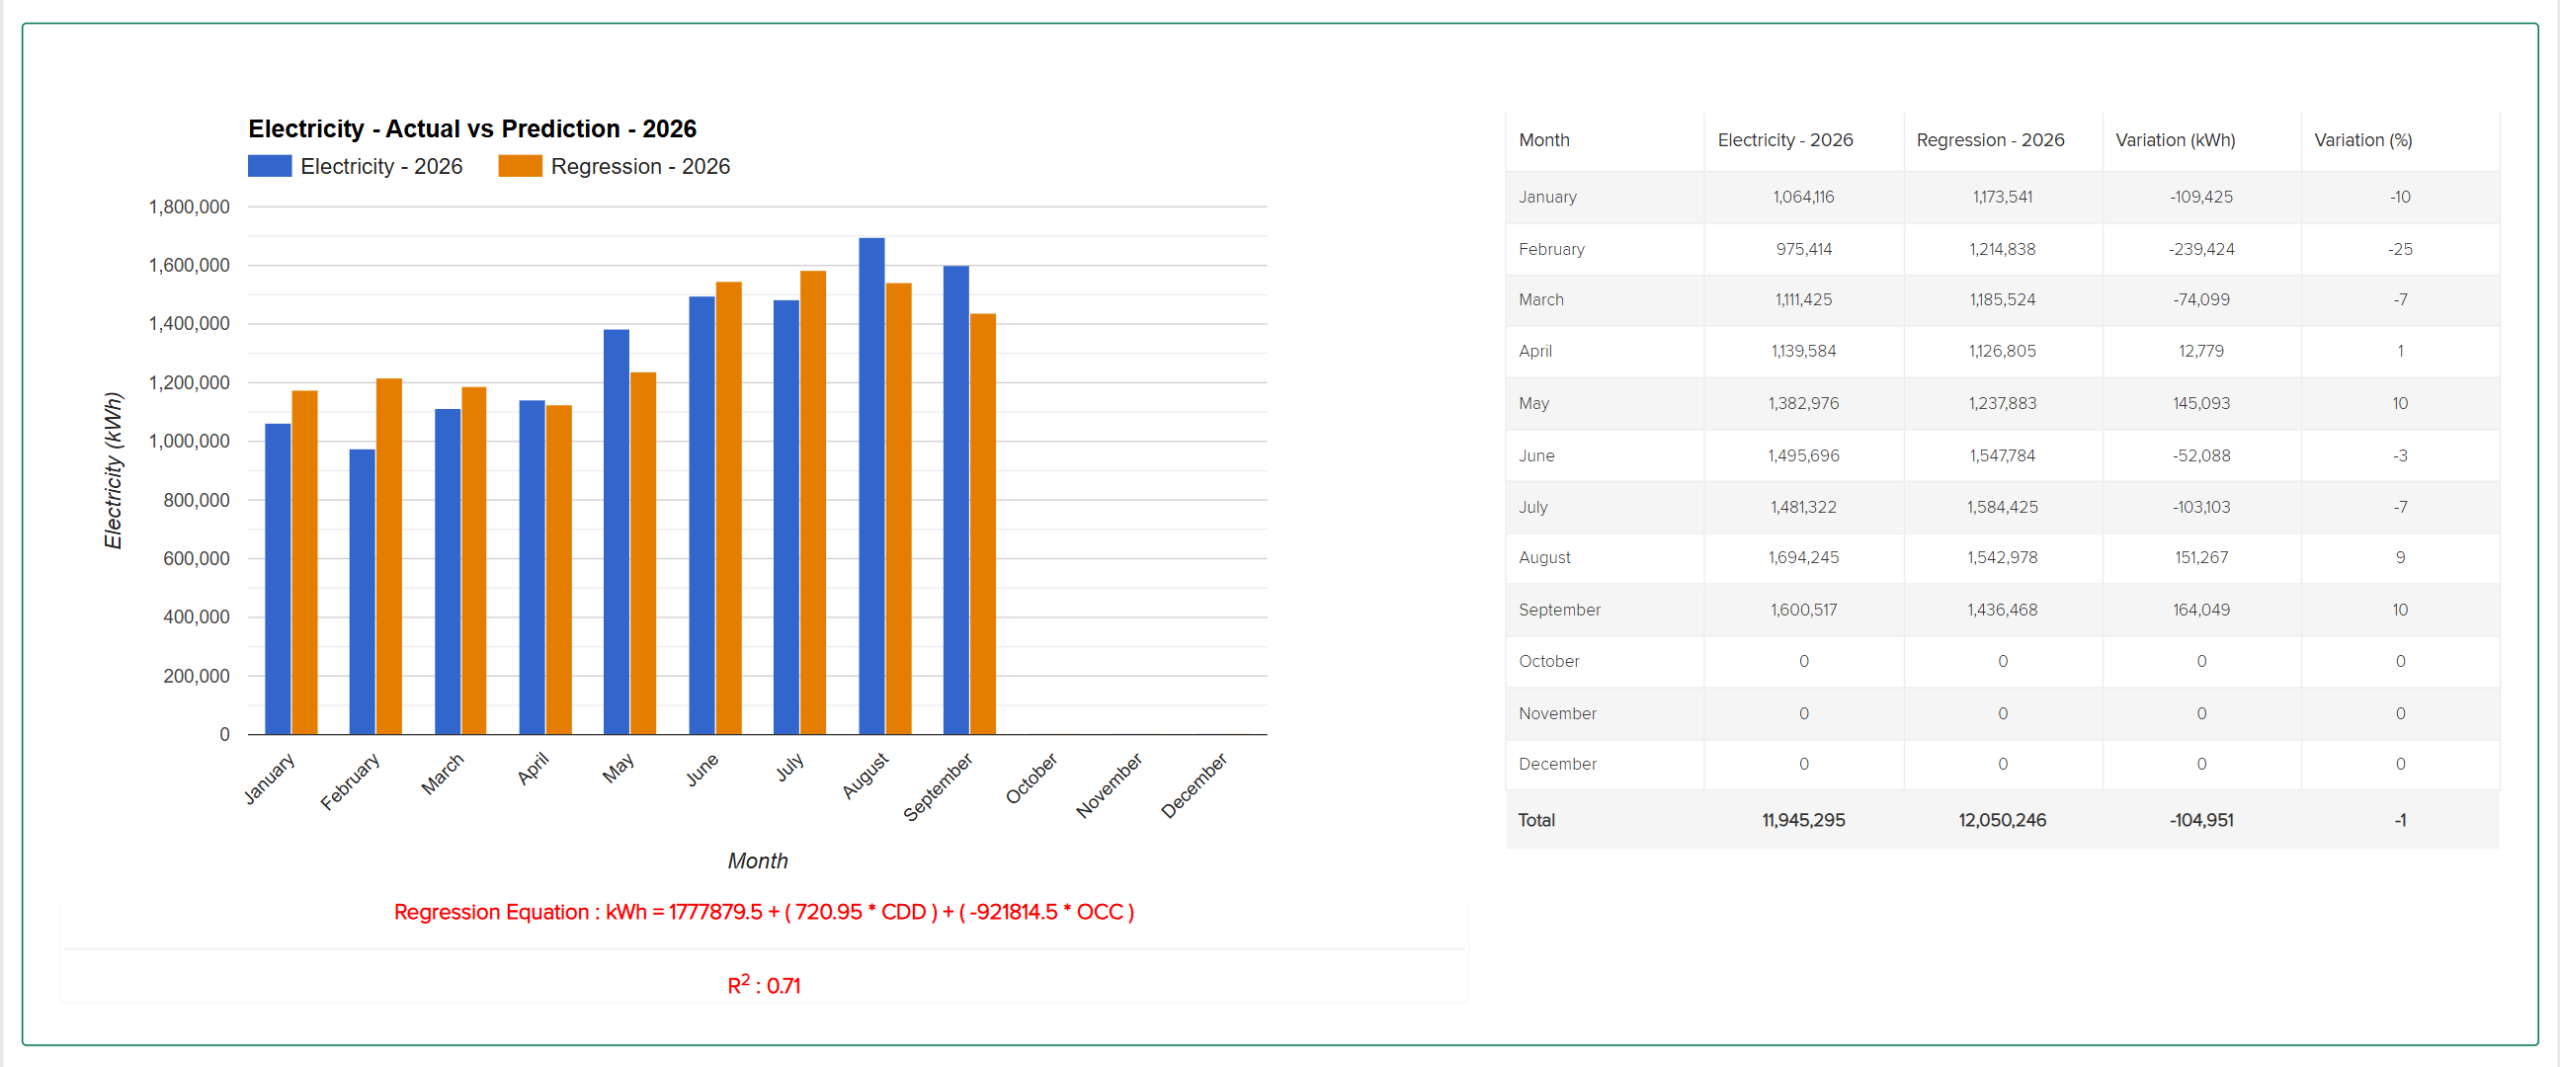
Regression analysis
Prove a reduction was real, not a mild winter or a quiet month.
- Actual vs predicted consumption
- Regression equation and R² shown
- Available for any utility service
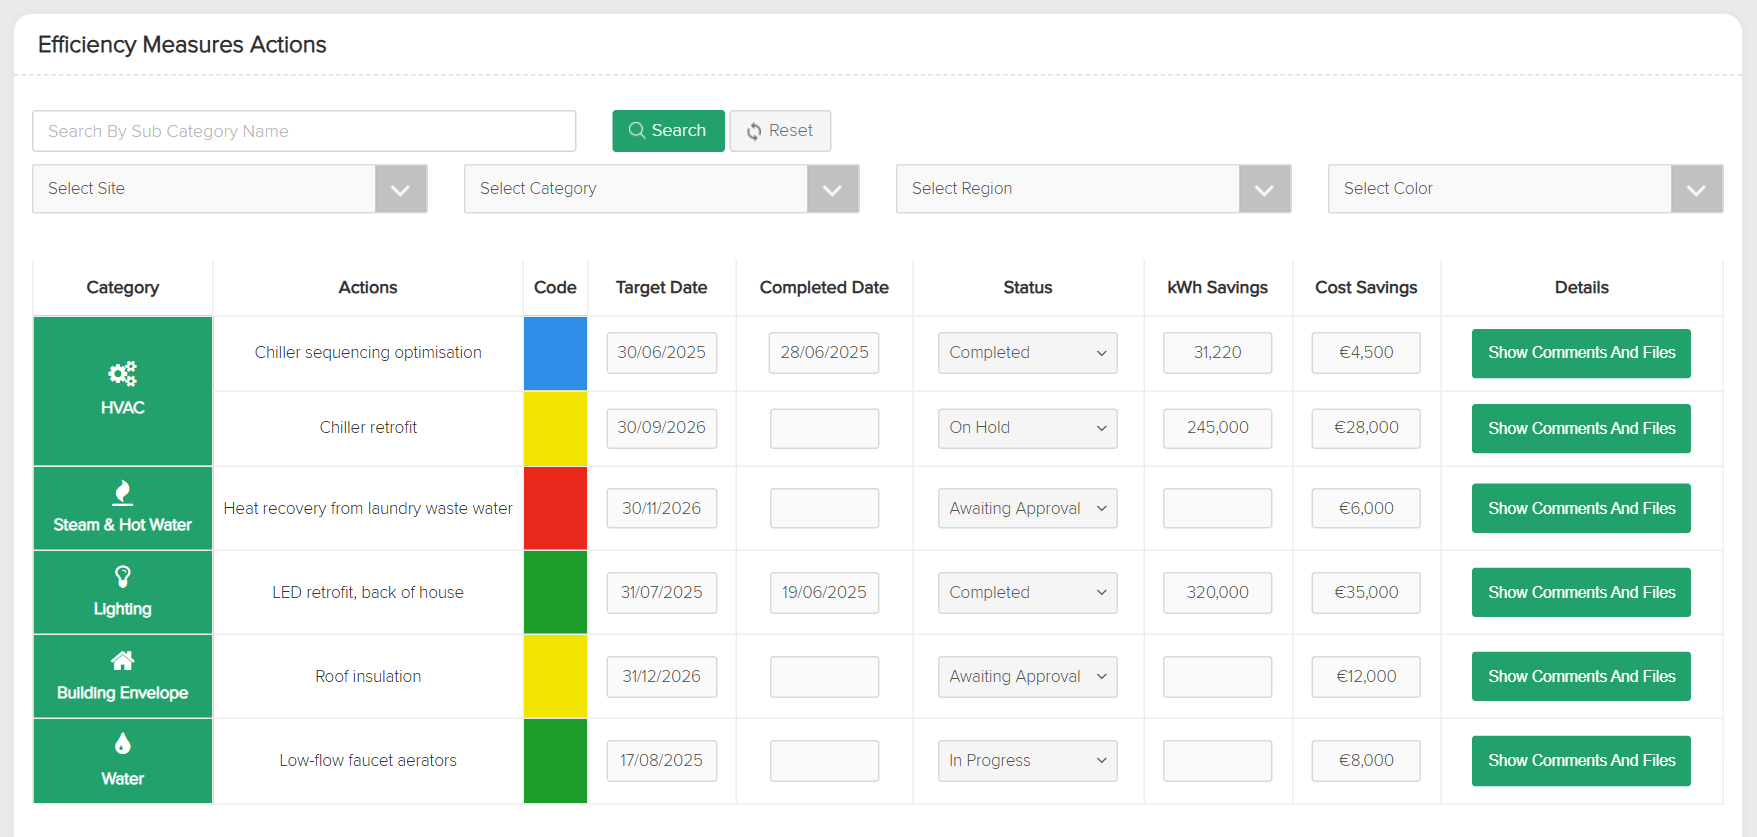
Efficiency measures & knowledgebase
From a shared catalogue of measures to a tracked action plan.
- Six categories with action groups
- Adopt a measure, or contribute one
- EMA Centre tracks who is doing what
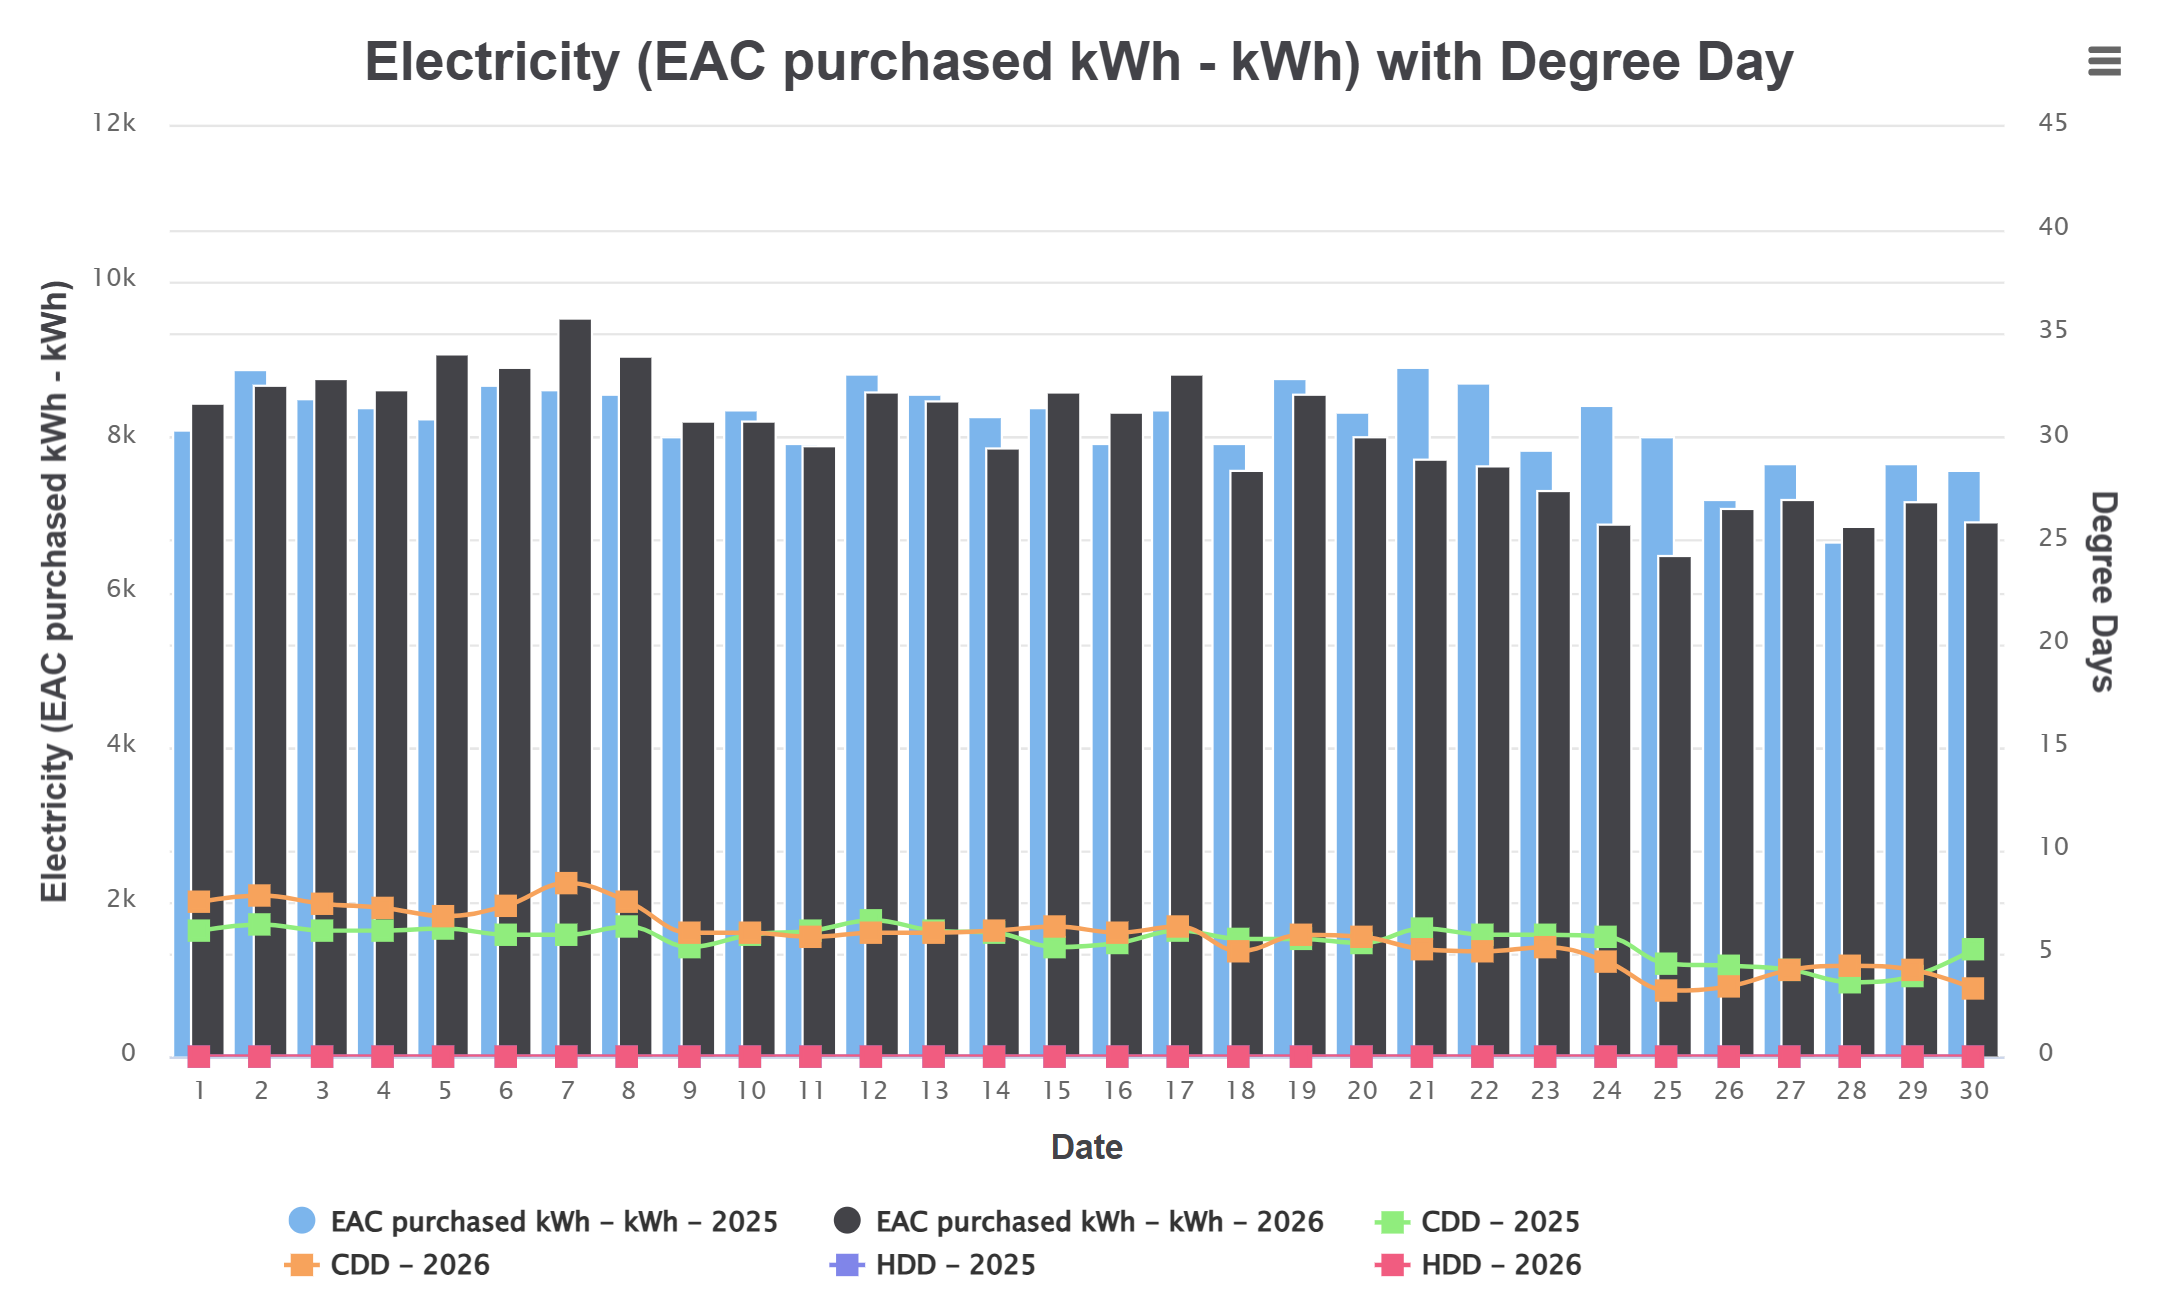
Submetering
Unlimited submeters, structured around your building.
- Individual or stacked meter views
- Climate and occupancy overlaid
- By system, department or area
Dispatch & data-gap alerts
Reports pushed out, and missing uploads chased for you.
- Alerts for sites that have not uploaded
- 10 and 20-day trend reports
- Full monthly report plus year-to-date
Energy Audit Centre
A repository for audit reports and the assets they describe.
- Audit report files per property
- Individual asset lists alongside
- Accessible across the group
Reporting that comes out of the data, not out of a spreadsheet exercise.
The carbon figure and the energy figure come from the same meter reading, so there is no reconciliation step and no second version of the truth held somewhere else.
Science-based targets
Energy, carbon, water and waste — with consumption and intensity tracked against target year to date on every property dashboard.
Scope 1, 2 and 3 carbon
Scopes 1 and 2 calculated from your own consumption with emission factors maintained yearly per location, alongside Scope 3 value-chain emissions.
Waste management
Captured monthly in the same cycle as utilities, with stream-level volumes and cost feeding carbon and ESG reporting.
Sustainability survey
Eight topics from energy and water through to sourcing, community and residences, with evidence held against each.

The sustainability side keeps growing.
Scope 3 has joined Scope 1 and Scope 2, and further ESG capability is in build behind it — approached the same way as everything else here, by deriving it from data the properties are already submitting rather than adding another collection exercise. If your reporting obligations require something specific, tell us and it will shape the order we build in.
Move beyond ad-hoc efforts.
What a hotel group gets once the operational data and the sustainability reporting sit in the same place.
A unified view of performance
Every property measured the same way, comparable across regions and hotel types, with targets tracked daily and monthly rather than reviewed at year end.
Streamlined data collection for compliance
One validated dataset behind the utility reports, the carbon figures, the waste numbers and the ESG survey — collected once, in a form that survives scrutiny.
Data-driven insight for targeted investment
Benchmarking shows where the gap is, the knowledgebase shows what has worked elsewhere, and regression shows whether the money delivered.
One dataset, four different jobs.
User roles and site access are configured per property, so each team sees what it needs.
EHS Manager
Targets, carbon, waste, the ESG survey and CHSB benchmarking — all from validated operational data on the same daily and monthly cycle.
Engineering Director / Chief Engineer
Daily consumption, month-to-date position, submeter behaviour, and the measures worth implementing next.
Finance & controller
Utility cost by month and against budget year to date, with trend reports mid-month.
Group & ownership
Portfolio comparison, progress against group commitments, and where the next investment belongs.
Before you book a demo
Do our properties need automated metering?
No. HEP makes use of the existing infrastructure and practices of hotels. Raw daily and monthly data uploads through Excel connectors that attach to the sheets each property already keeps. The IoT module, which enables real-time acquisition from meters and equipment, is entirely optional.
Does HEP cover carbon and ESG, or just utilities?
Both, with equal weight. Carbon is calculated from your own consumption using emission factors maintained yearly per location; waste is captured monthly alongside utilities; the ESG survey covers eight topics with evidence; and science-based targets for energy, carbon, water and waste are tracked on every property dashboard.
Which carbon scopes are covered?
Scope 1, Scope 2 and Scope 3. Scopes 1 and 2 are calculated directly from your consumption using emission factors maintained yearly per location; Scope 3 covers the value-chain emissions around them. Further ESG capability is in development behind it.
How is HEP different from an ESG reporting platform?
Hotels already report monthly, and most platforms in this category are built to receive exactly that — a monthly figure formatted for a disclosure framework. HEP keeps the monthly cycle and adds daily tracking underneath it, then does the sustainability reporting from the same dataset: targets, carbon, waste, ESG survey and CHSB benchmarking. You get the compliance output and the operational control from one system. There is a fuller version of this argument on Why HEP.
Ready to lead in sustainability and operational efficiency?
Send us one property's utility history and we will set up a live site so you can see the dashboards, the target tracking, the carbon reporting and a regression model built from your own data — not a demo account.
- Your data, your property, your currency
- A 30-minute walkthrough with an engineer
- No obligation and no cold-calling afterwards
Request a web demo
We will come back to you within one working day.
We only use your details to arrange the demo.