
Home/Platform/Targets & Benchmarking
Sustainability & ESG · Targeting & benchmarkingSet your sights high, then prove where you stand.
Define science-based reduction targets for energy, waste and carbon, position each property against the hospitality peer set, and run comparative analysis inside your own group to find best practice.
A target only means something if it is tracked.
Targets are set per property and per resource, then measured against actuals every month and every day — not reviewed when the reporting deadline arrives.
Energy
Consumption and intensity targets, normalised for climate and occupancy so the comparison is fair.
Carbon
Reduction trajectories built on your own consumption, with emission factors applied per location.
Water
Consumption and intensity against target, tracked in the same cycle as energy.
Waste
Reduction targets alongside the monthly waste capture, so the goal and the data sit together.
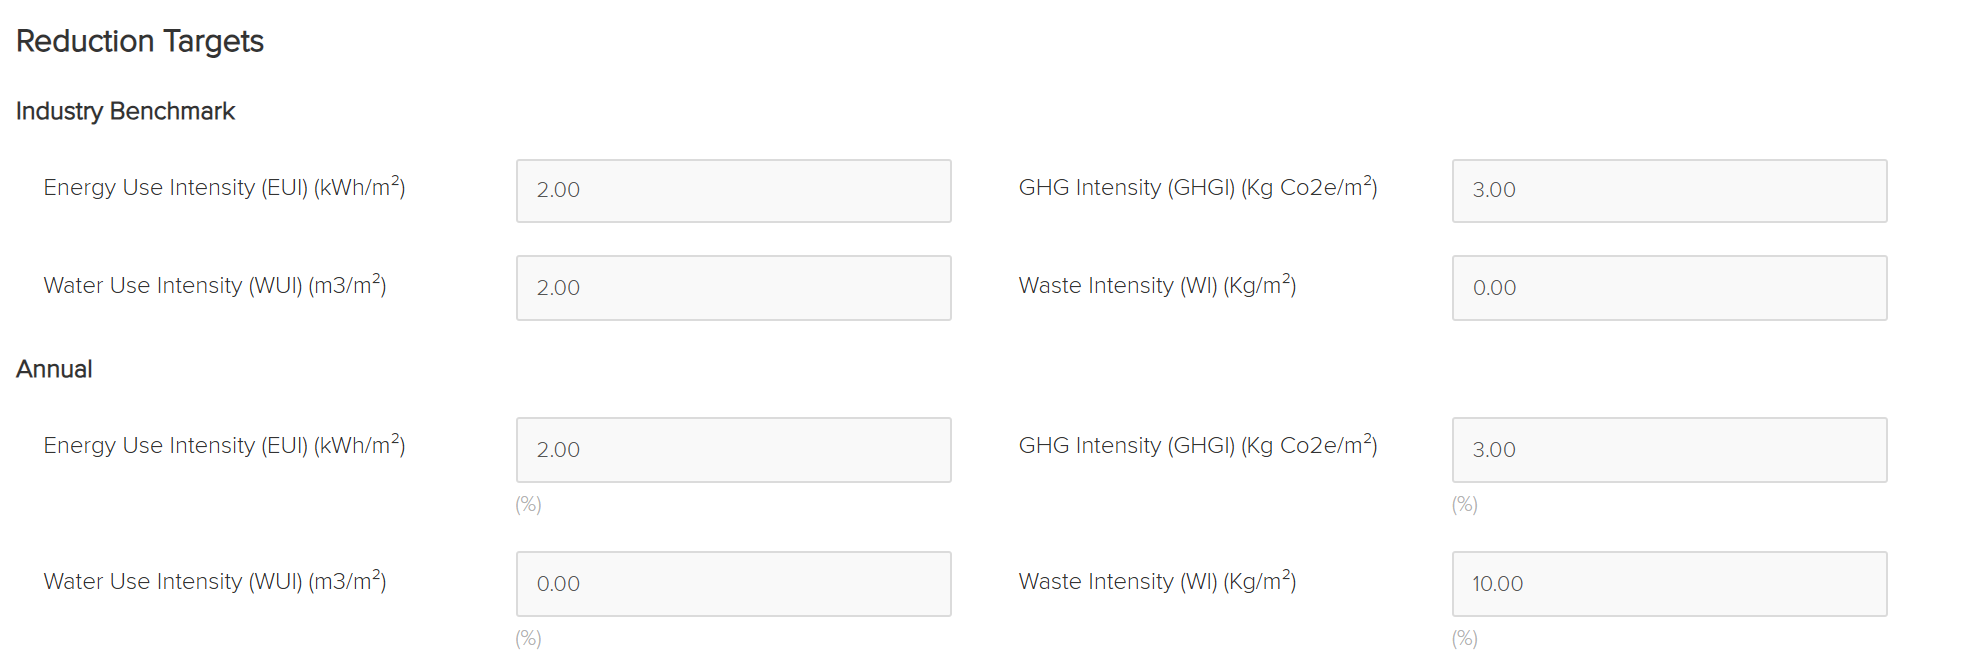
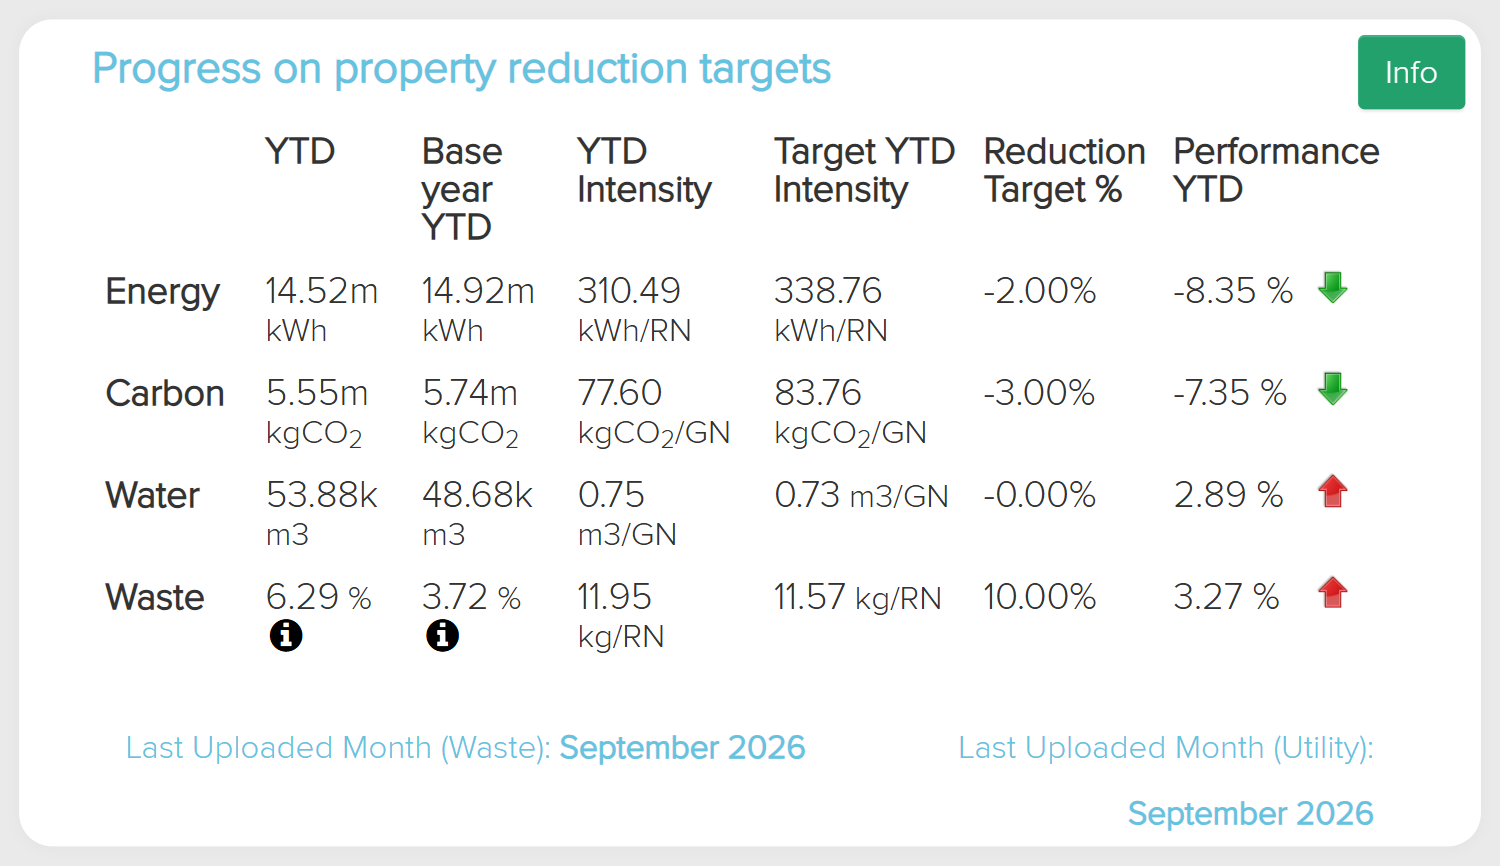
Progress against reduction targets
The first card on every property dashboard. Six columns, three resources, no interpretation required.
- Consumption year to date against target consumption year to date.
- Intensity year to date against target intensity — the metric that survives a change in occupancy.
- Reduction target percentage stated explicitly, per resource.
- Performance year to date, so a property knows on any given day whether it is ahead or behind.
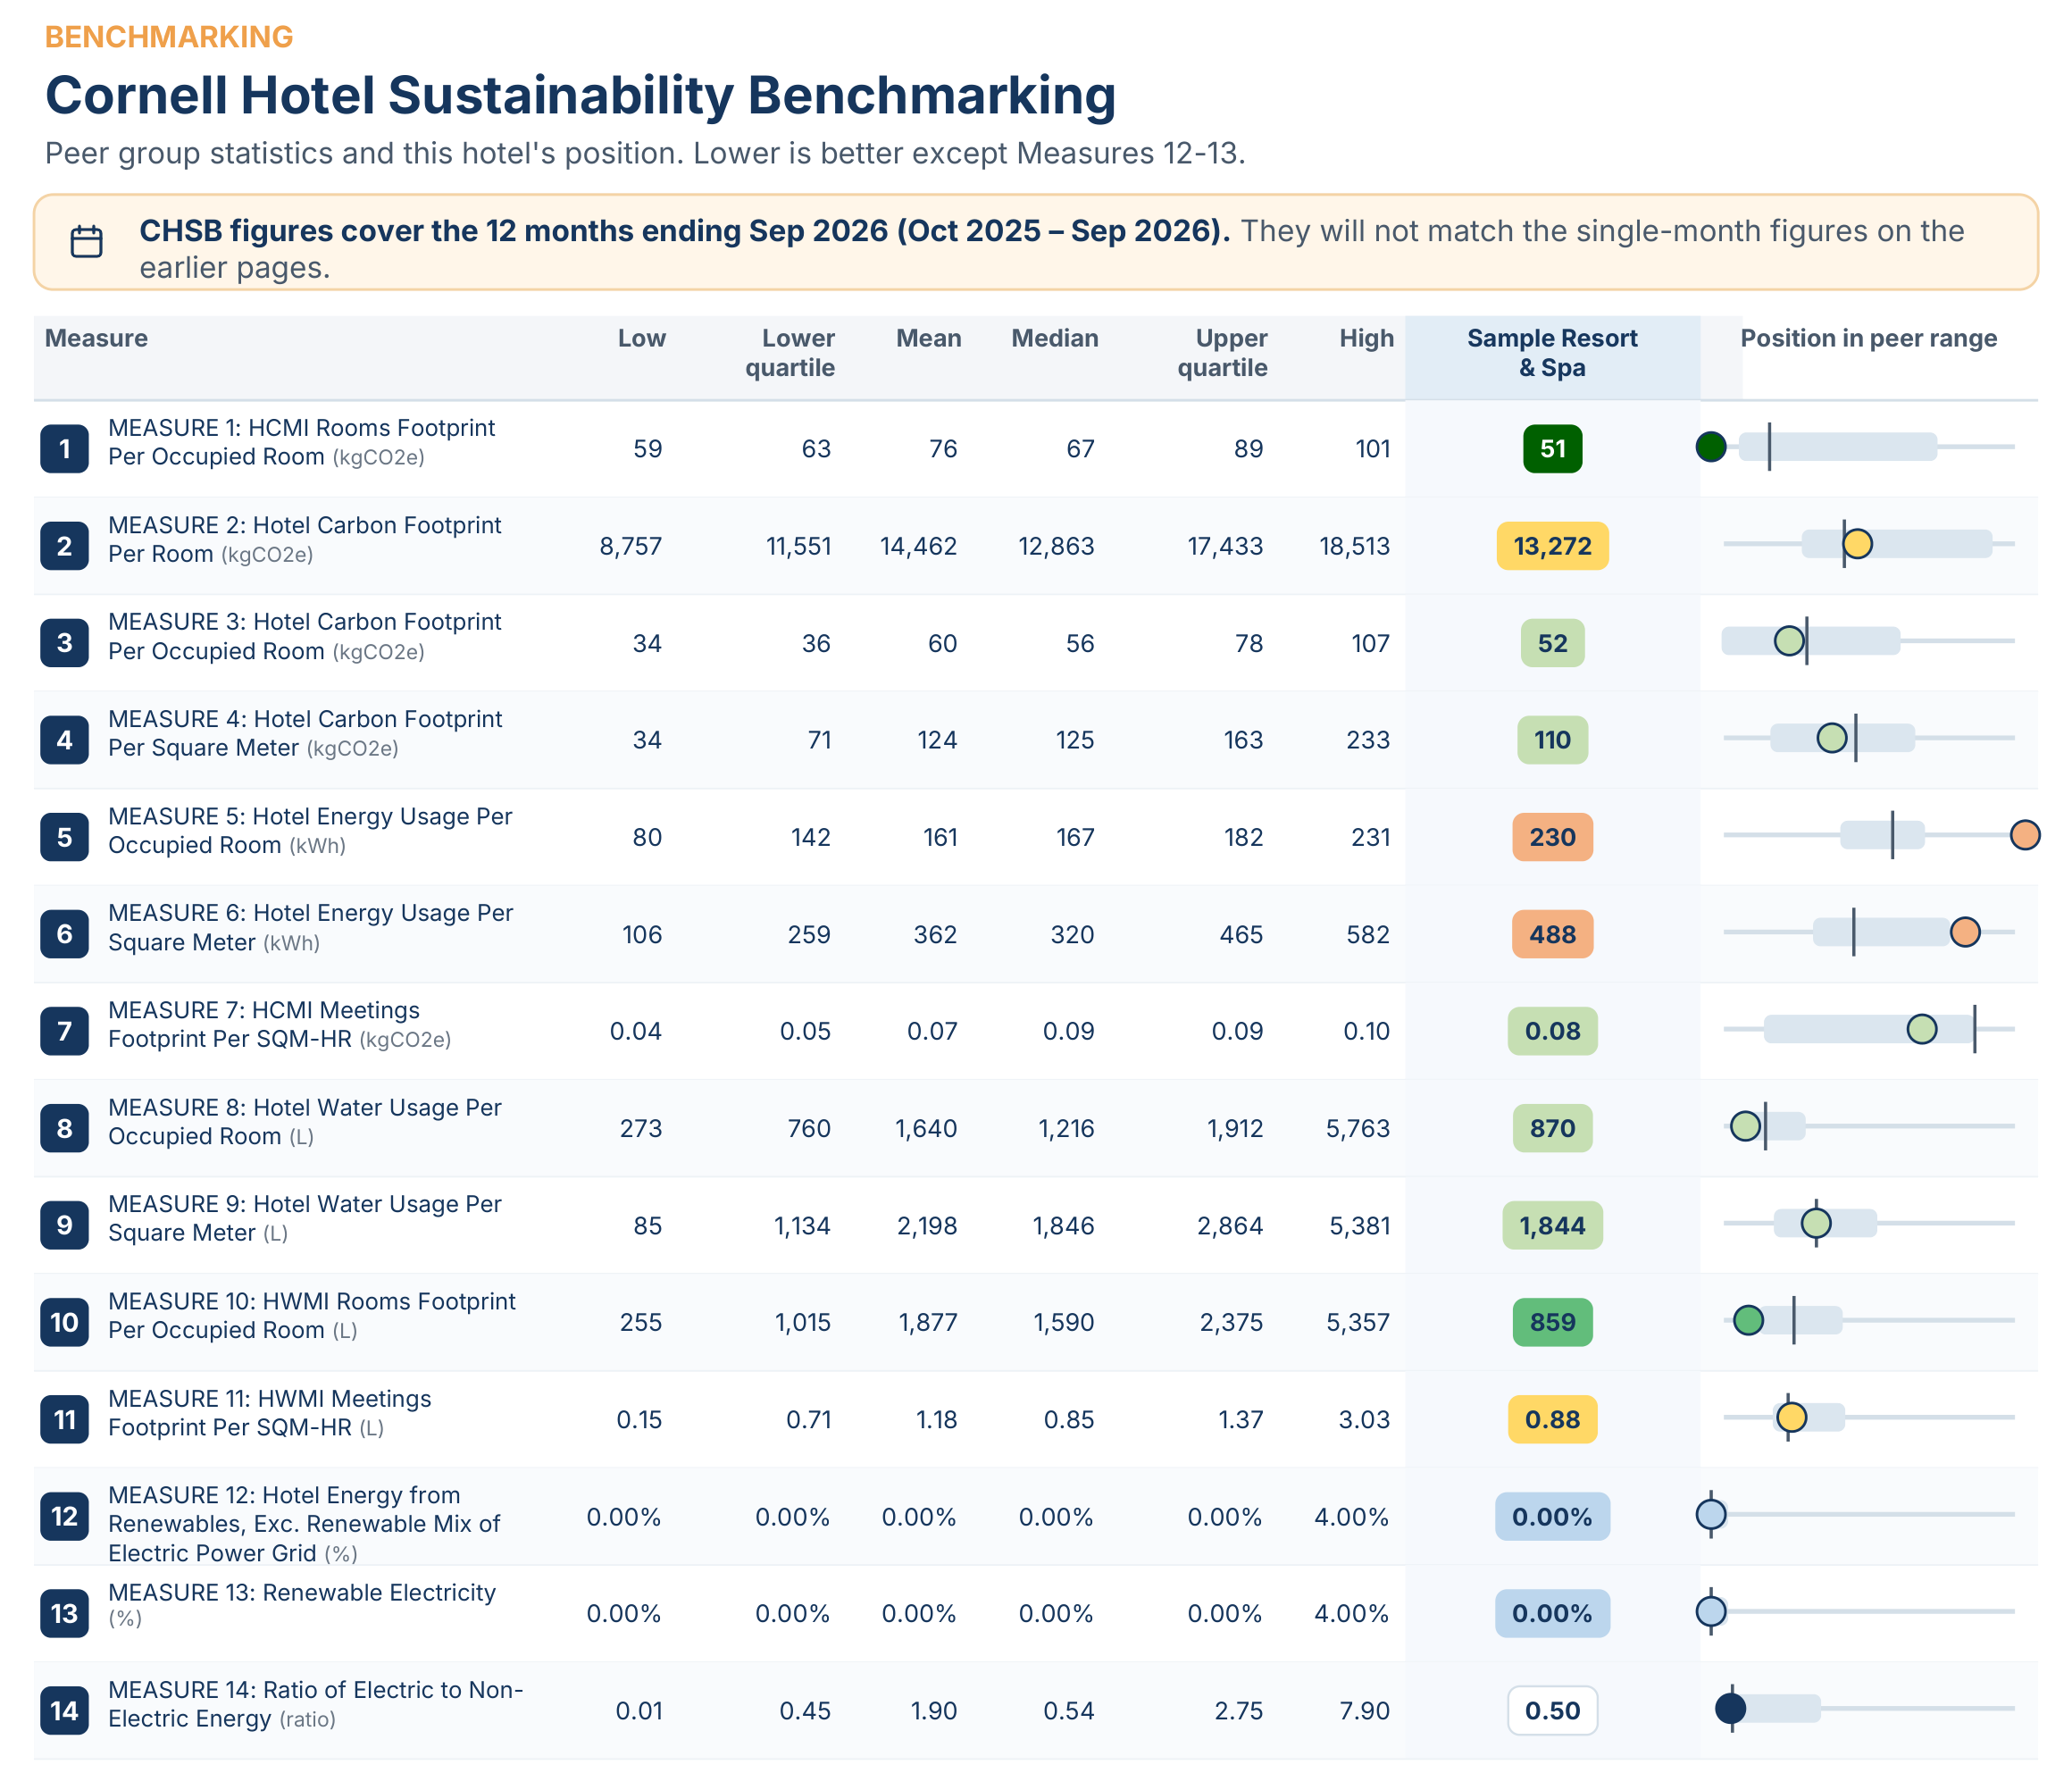
Cornell Hotel Sustainability Benchmarking
Better than last year is not the same as good. CHSB positions each asset against the hospitality peer set, so a property knows whether its intensity is genuinely strong for its type and climate.
- Peer comparison by hotel type and climate zone rather than a single global average.
- Credible externally — an independent index carries more weight with owners and lenders than an internal number.
- Gap to peer makes the case for investment concrete rather than aspirational.
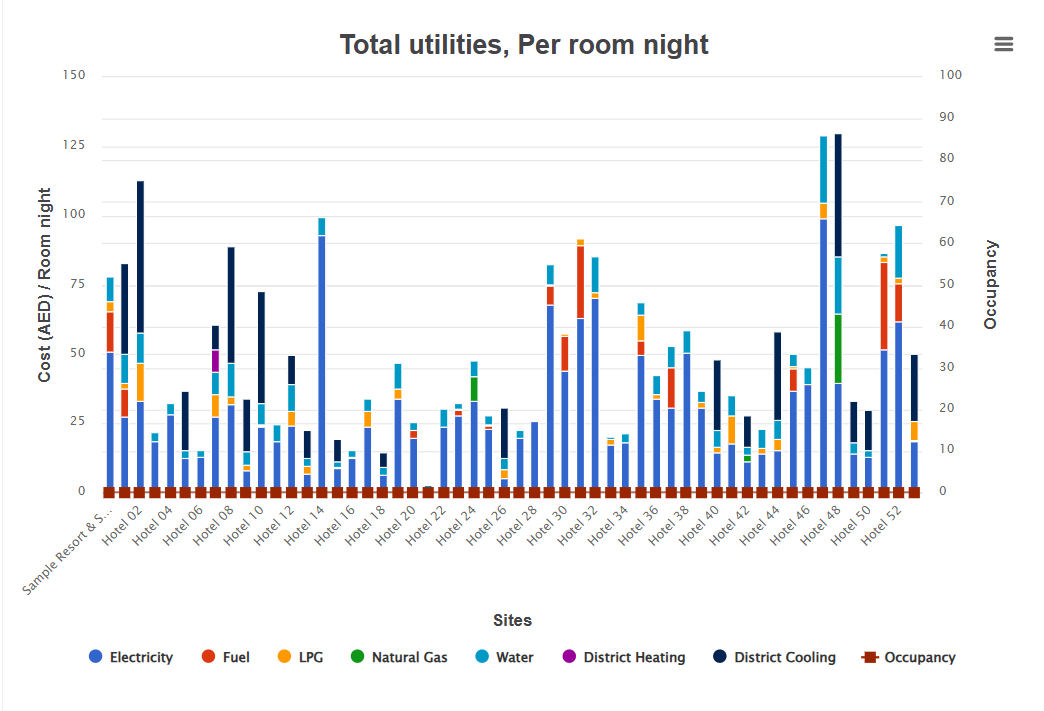
Comparative analysis to find best practice.
Full comparative analysis of any given hotels on any utility parameter, segregated by region or by type of hotel — to identify best practices and areas for improvement.
- Rank the portfolio on intensity or cost per room night.
- Segregate by region or hotel type so resorts are compared with resorts.
- Then find out what they did — the leading property's action plan is in the EMA Centre, ready to copy.
About targets and benchmarking
Which resources can we set targets for?
Energy, carbon, water and waste. Each is tracked against actuals year to date on the property dashboard, in both absolute consumption and intensity.
Can we benchmark against the industry?
Yes, through the Cornell Hotel Sustainability Benchmarking index, alongside internal comparison across your own portfolio by region or hotel type. That sits on the targeting & benchmarking page.
How is the comparison kept fair between very different hotels?
Through normalisation — intensity metrics per room night, guest night or built-up area, and climate correction using cooling and heating degree days that update automatically every day.
See where your properties actually stand.
Send us one property's history and we will benchmark it.
Request a demo