
Regression analysis
HEP builds a regression model from a baseline year of your choice, then tracks actual against predicted consumption for the period that follows. It is the right way to prove an efficiency project worked.
- Baseline year of your choice, with the regression equation generated from it.
- Actual versus predicted consumption tracked forward, month by month.
- Drivers included — cooling degree days, heating degree days and occupancy.
- Any utility service — electricity, district cooling, gas, water and the rest.
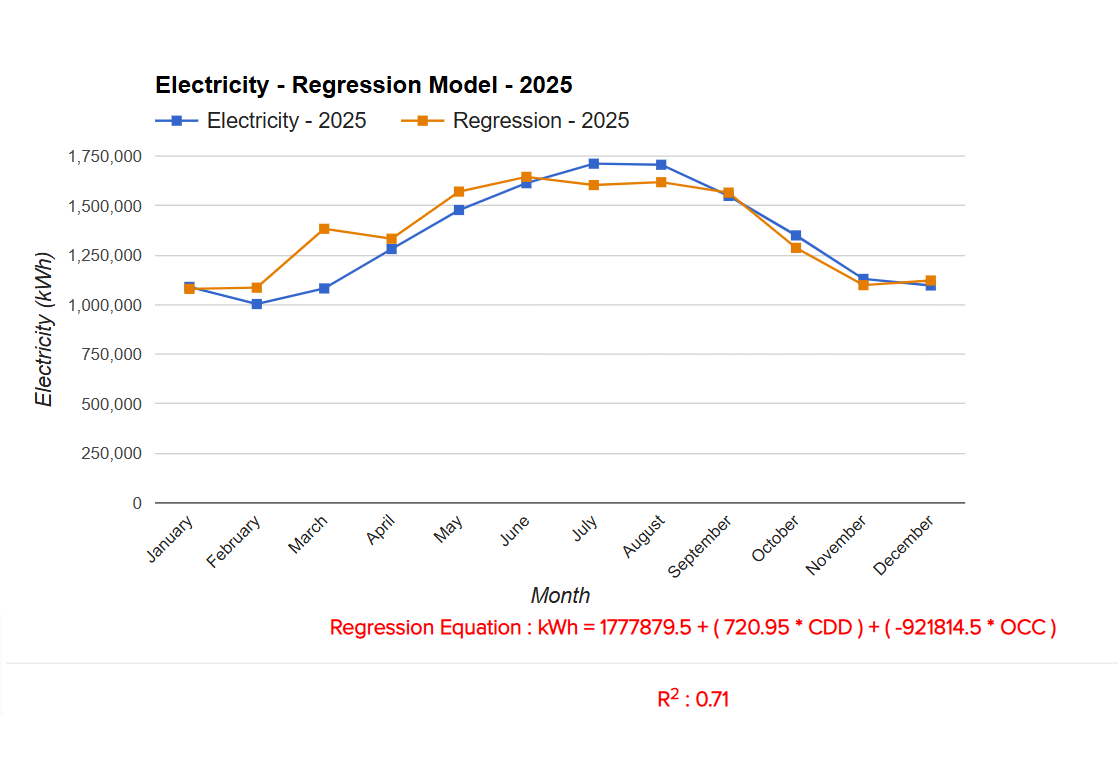
Auditable, not a black box.
HEP shows the model, not just its conclusion — which matters when a finance director or an auditor asks where a savings figure came from.
The equation
kWh = 536959 + (90.94 × CDD) + (−41605 × OCC)
The baseline year produces a formula. The constant is the load that runs regardless; the coefficients are how much consumption moves with cooling demand and with occupancy.
R²
R² : 30.55
How much of the variation the model explains. A low value is information too — it usually means something other than weather and occupancy is driving consumption, which is worth investigating.
Variation
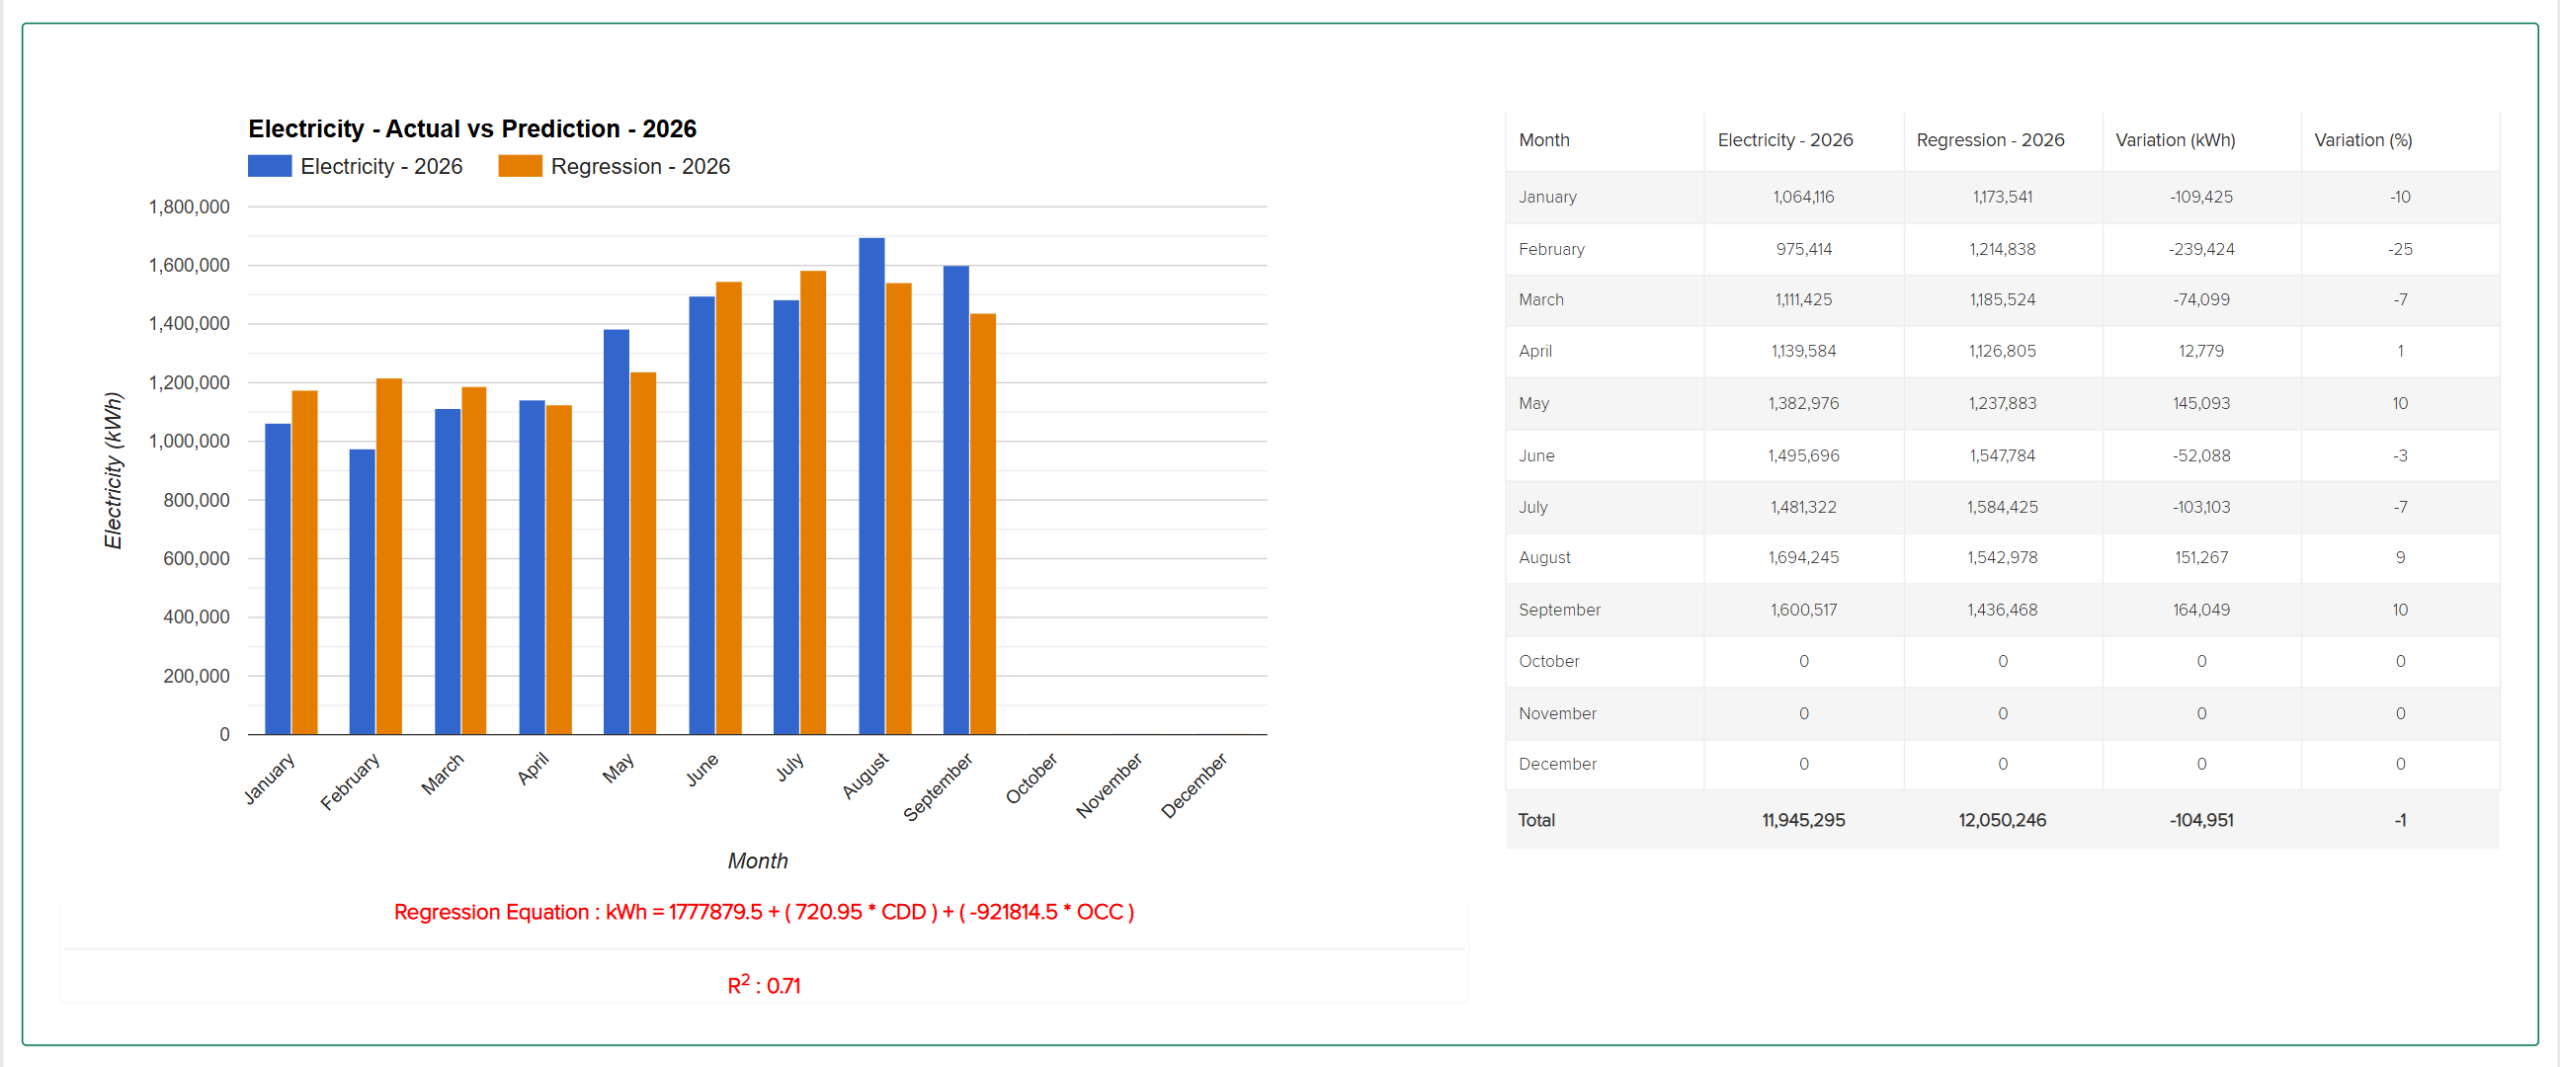
−20,132 kWh · −4%
Actual against predicted for each month and for the year total, in kWh and per cent. This is the number that represents a genuine saving rather than a mild winter.
Month-to-date reporting
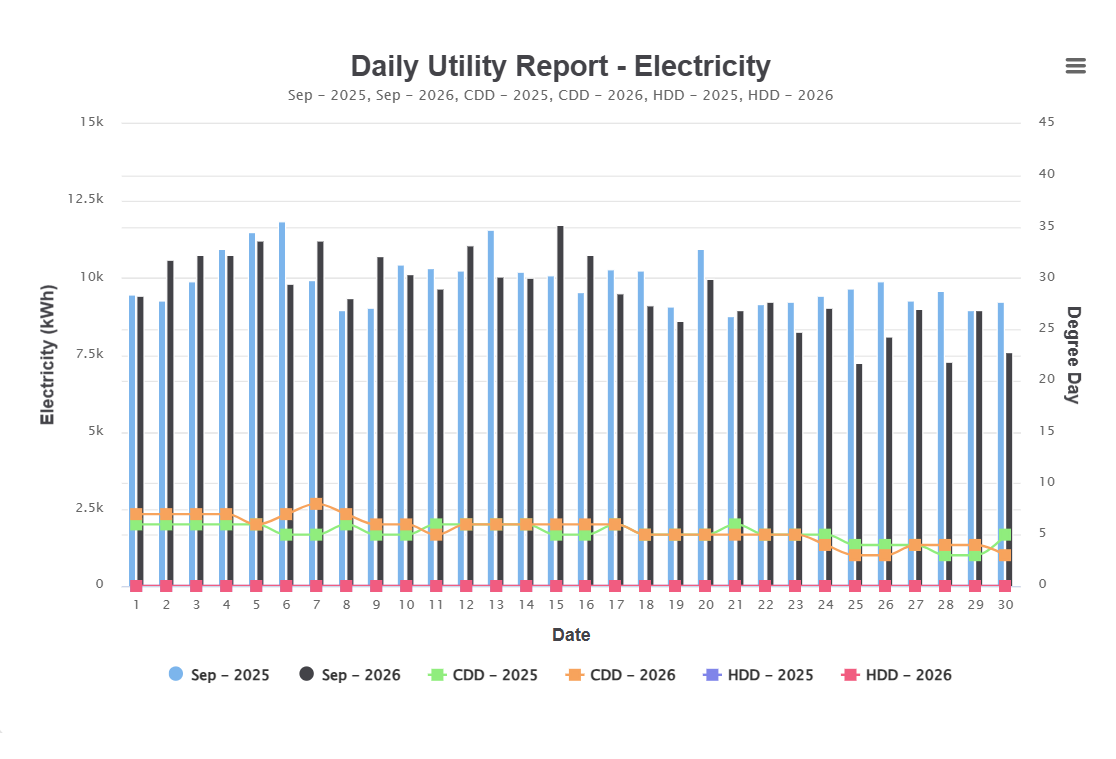
Daily data analysis giving visibility of a month-to-date view — daily and accumulated figures for all key utility parameters and KPIs.
- Against the same period last year, day for day.
- Against the equivalent number of days of budget — not the whole month, so the comparison is fair mid-month.
- Correlated with climatic conditions and occupancy for both years.
- Daily comparative charts available for every utility.
Regression tells you whether you improved. Benchmarking tells you whether that is good.
A property can beat its own baseline and still sit well behind its peers. Science-based targets for energy, carbon, water and waste, and Cornell CHSB positioning against the hospitality peer set, have their own page.
See targeting & benchmarkingComparative analysis across the group
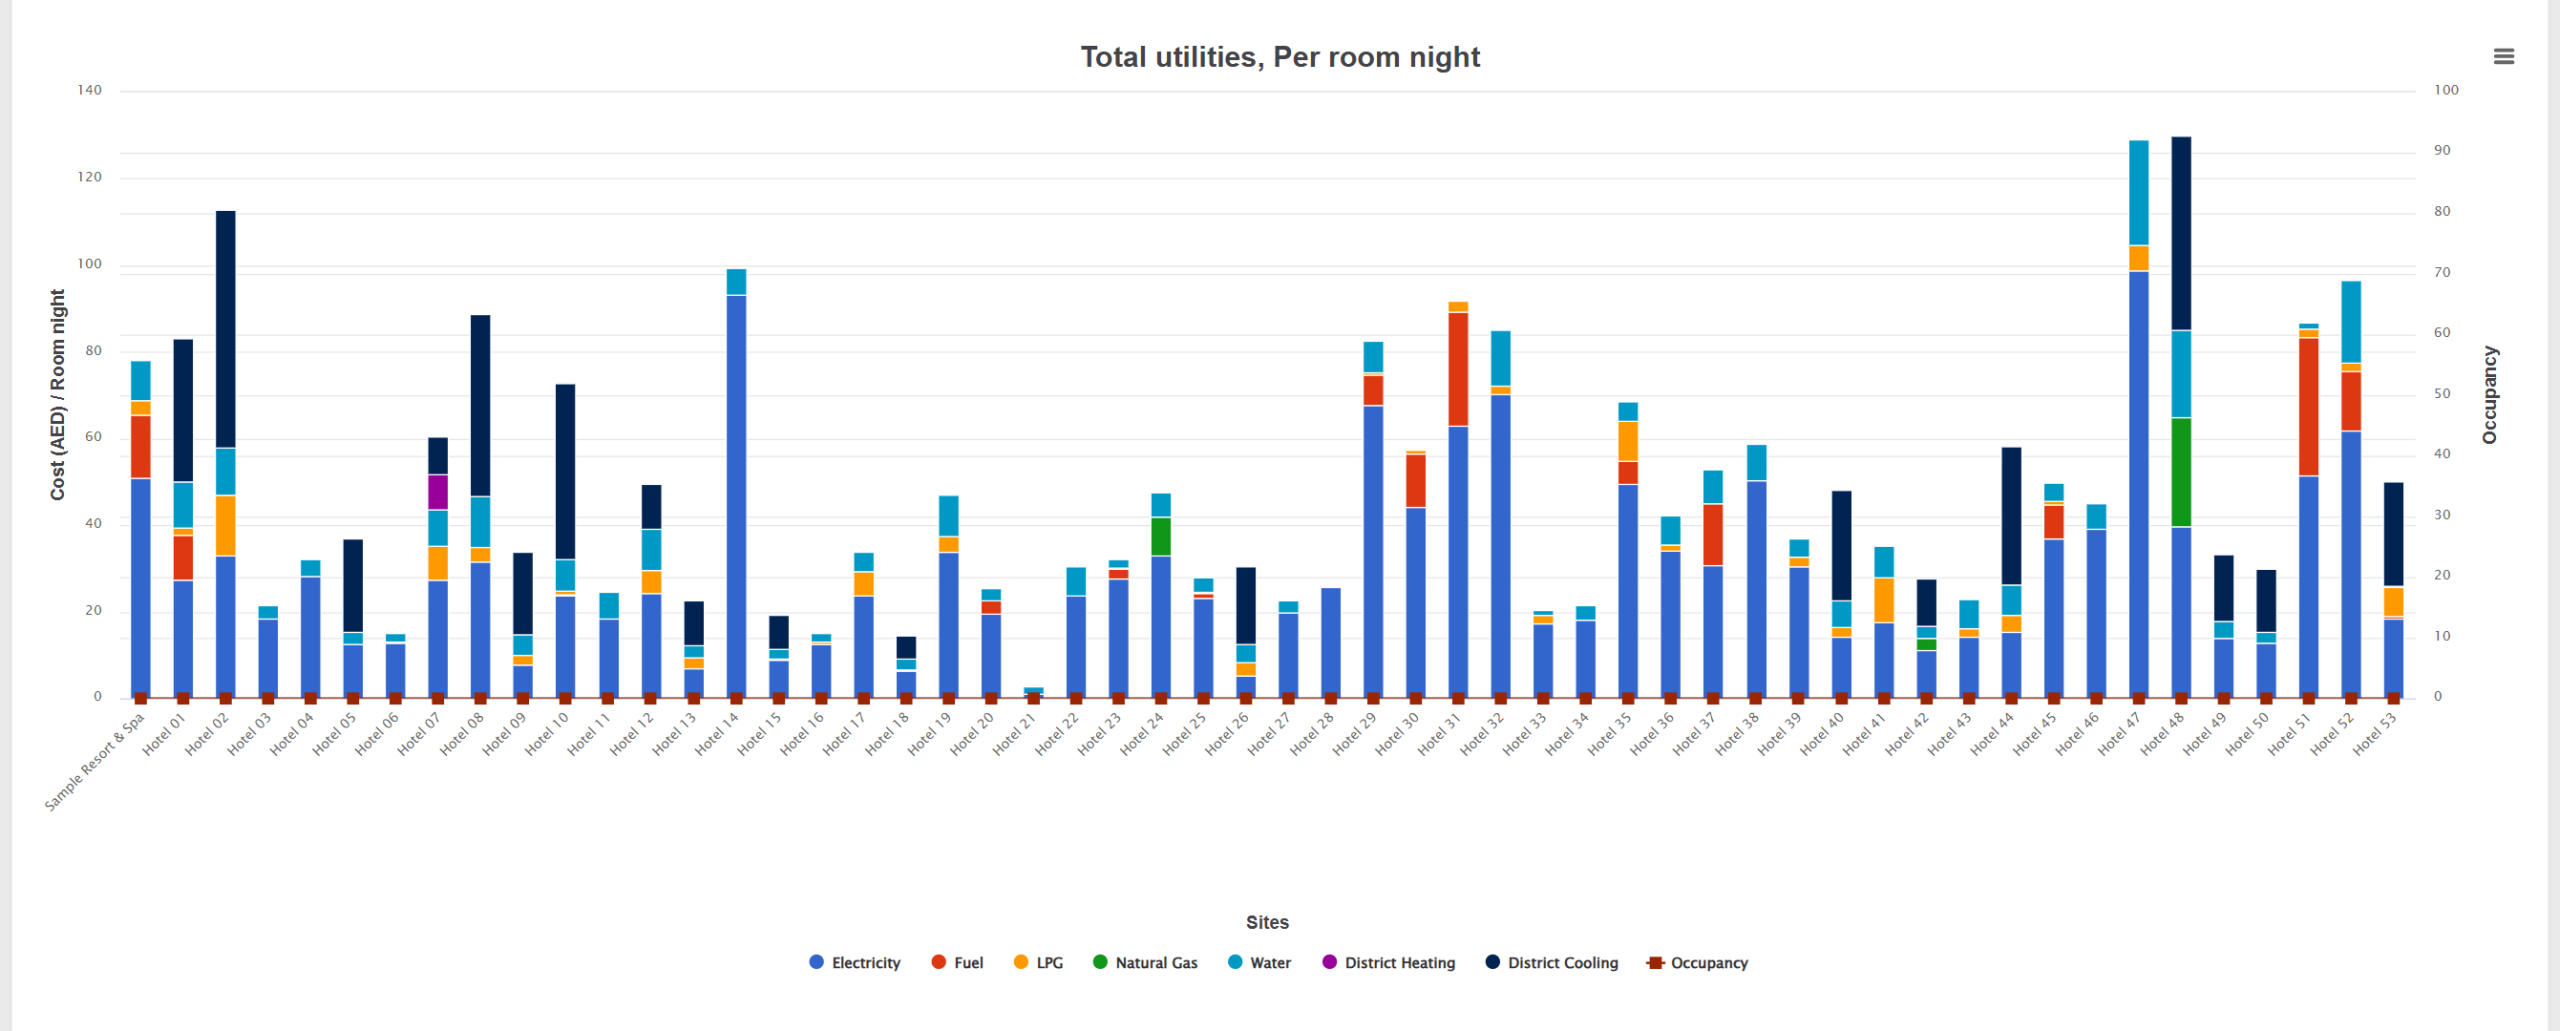
Full comparative analysis of any given hotels on any utility parameter, segregated by region or by type of hotel.
- Rank the portfolio on cost or intensity per room night.
- Segregate by region or hotel type so resorts are compared with resorts.
- Identify best practice — and then find what that property did in the EMA Centre.
About analytics
How do we know an efficiency project actually worked?
Regression analysis. HEP builds a regression model from a baseline year of your choice and then tracks actual against predicted consumption for the period that follows, so savings are measured on a like-for-like basis rather than against a raw year-on-year number.
What drives the regression model?
Cooling degree days, heating degree days and occupancy. The regression equation and R² are shown, so the model is auditable rather than a black box, and monthly variation is reported in both kWh and per cent.
Can we benchmark against the industry?
Yes, through the Cornell Hotel Sustainability Benchmarking index, alongside internal comparison across your own portfolio by region or hotel type. That sits on the targeting & benchmarking page.
Run a regression on your own baseline.
Send us one property's history and we will build the model from it.
Request a demo