
Home/Platform/Carbon, waste & ESG
Sustainability & ESG · Carbon, waste & ESGSustainability reporting that comes out of the data.
Carbon accounting, waste tracking and ESG surveys all draw on the same validated utility data — so the numbers agree with each other by construction, rather than because somebody reconciled them at the deadline.
One dataset, two outputs.
Hotels already report monthly. Most sustainability platforms take that monthly figure — or an annual roll-up of it — and format it for a disclosure framework. That produces a report, but it produces a second version of the truth, sitting apart from whatever the engineering team uses day to day, and at a cadence too coarse to act on.
HEP takes the opposite route. The daily and monthly operational data is collected first, validated on the way in, and then queried for whatever the sustainability report needs. The carbon figure and the energy figure come from the same meter reading. The waste number arrives in the same monthly cycle as the utilities. Nothing has to be reconciled because nothing was ever collected twice.
That is also what makes the reporting defensible. When an owner, an auditor or a lender asks where a number came from, the answer is a meter reading, a tariff and an emission factor — not a spreadsheet somebody assembled in March.
Scope 1, 2 and 3 carbon accounting
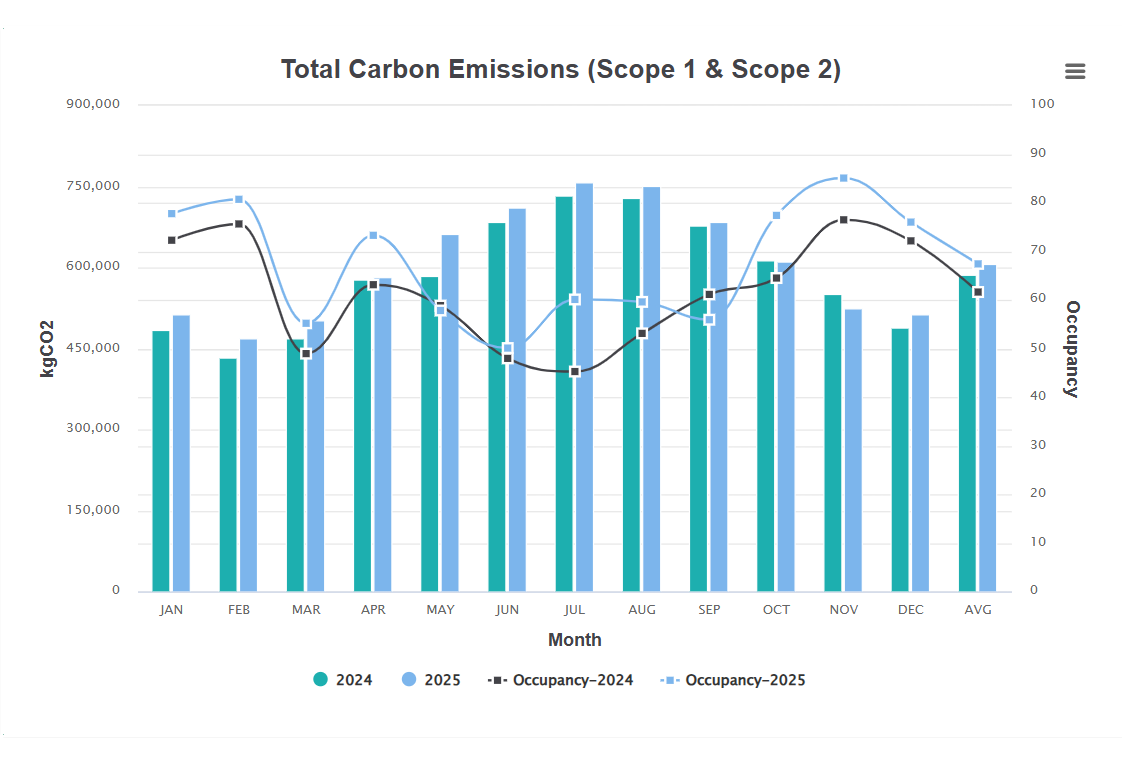
Scope 1, Scope 2 and Scope 3 accounting, with Scopes 1 and 2 calculated directly from the utility data already in the portal.
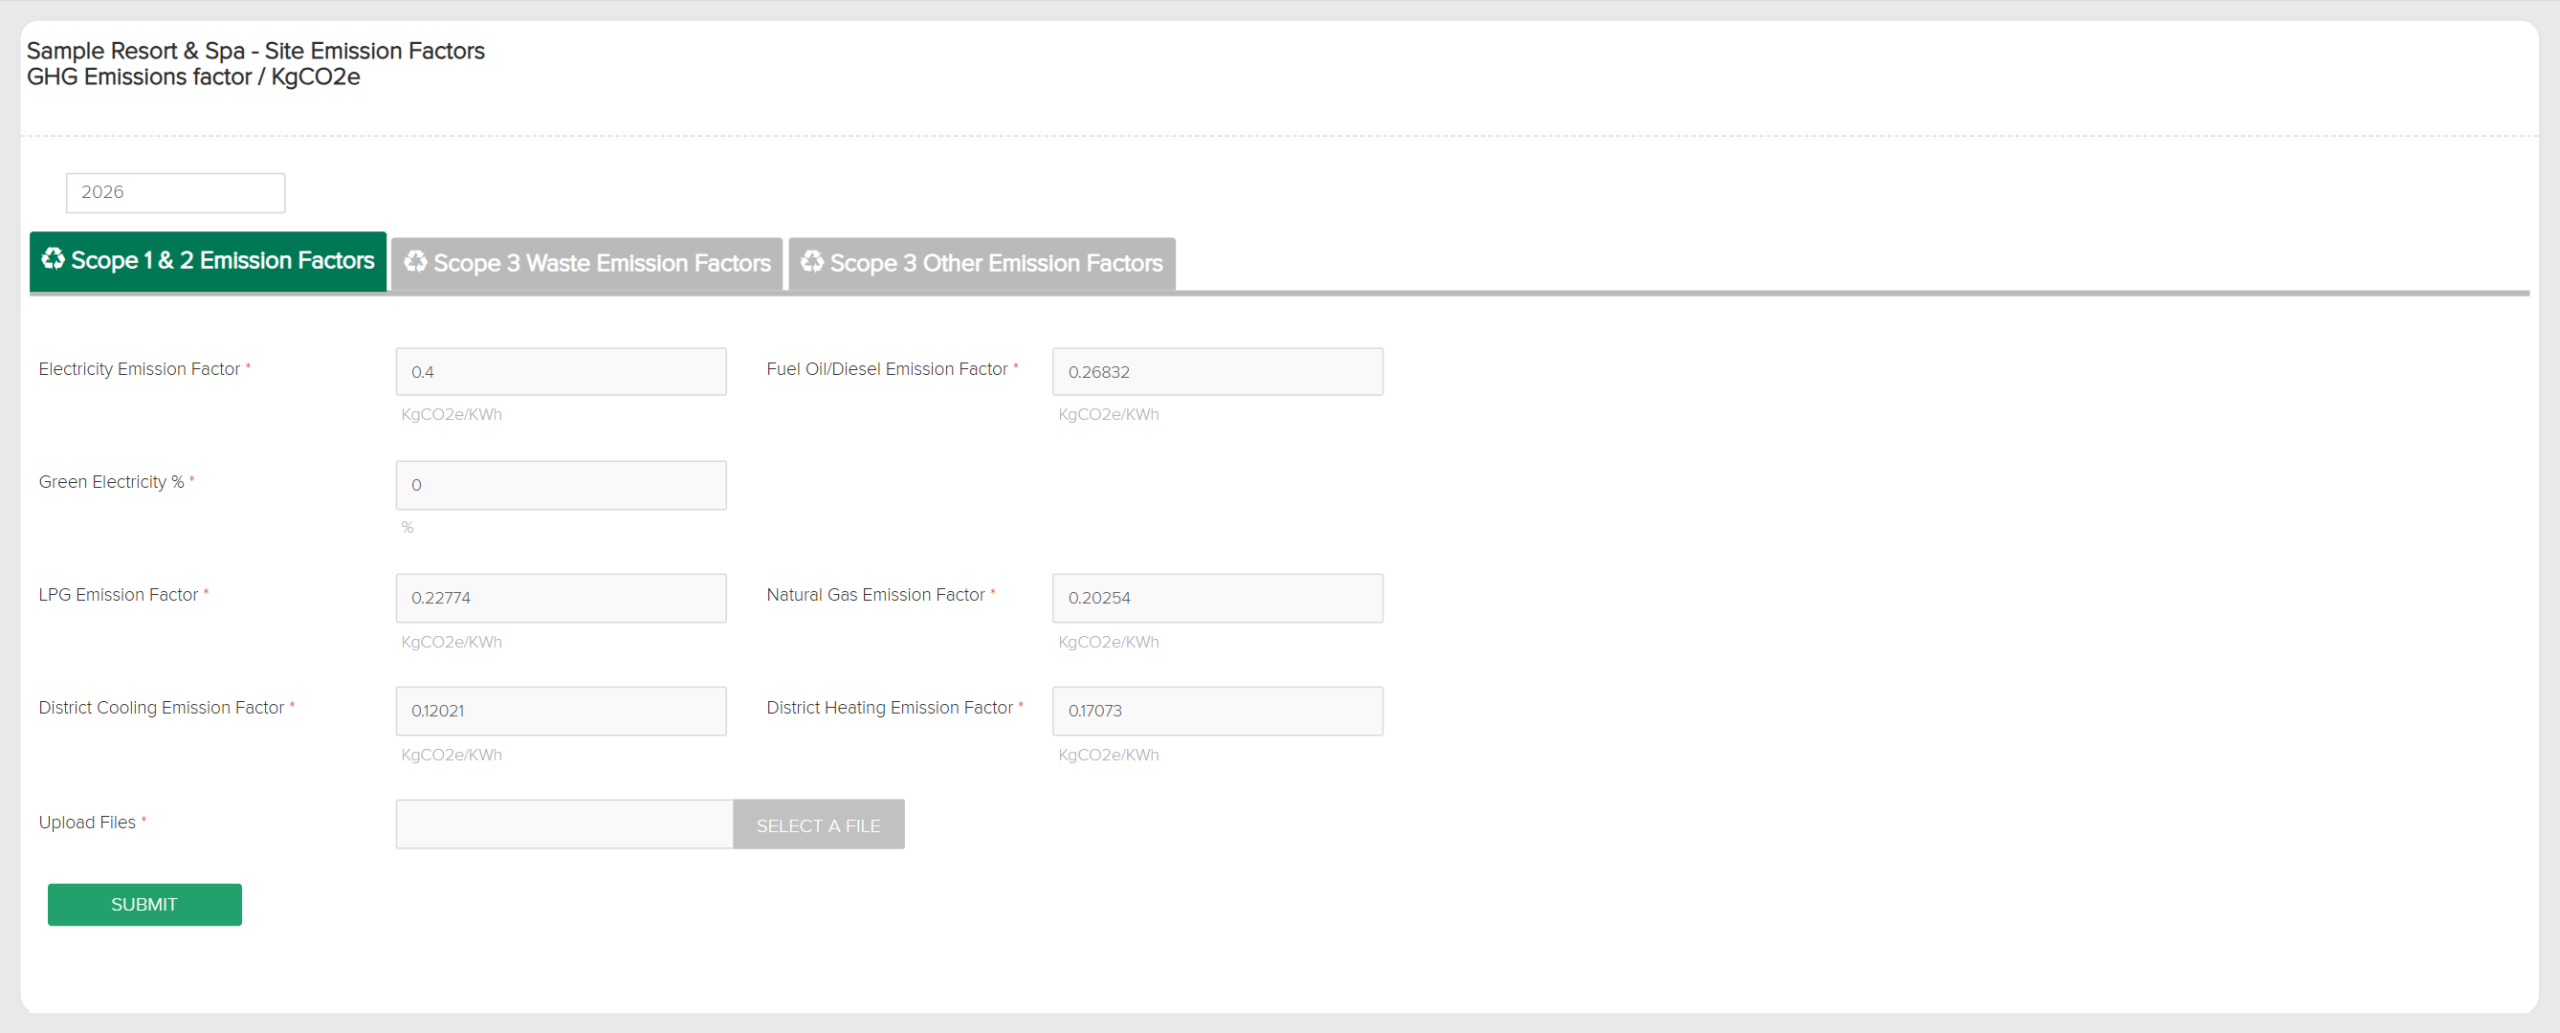
- Emission factors maintained yearly and applied per utility and per location, so carbon reflects the right grid for each country.
- Carbon footprint reports in the same library as the utilities reports, not a separate module with its own numbers.
- Carbon intensity against target on the property dashboard, tracked year to date alongside energy and water.
- Emission Factors Yearly is one of the five structured import streams, so factors are versioned rather than buried in a formula.
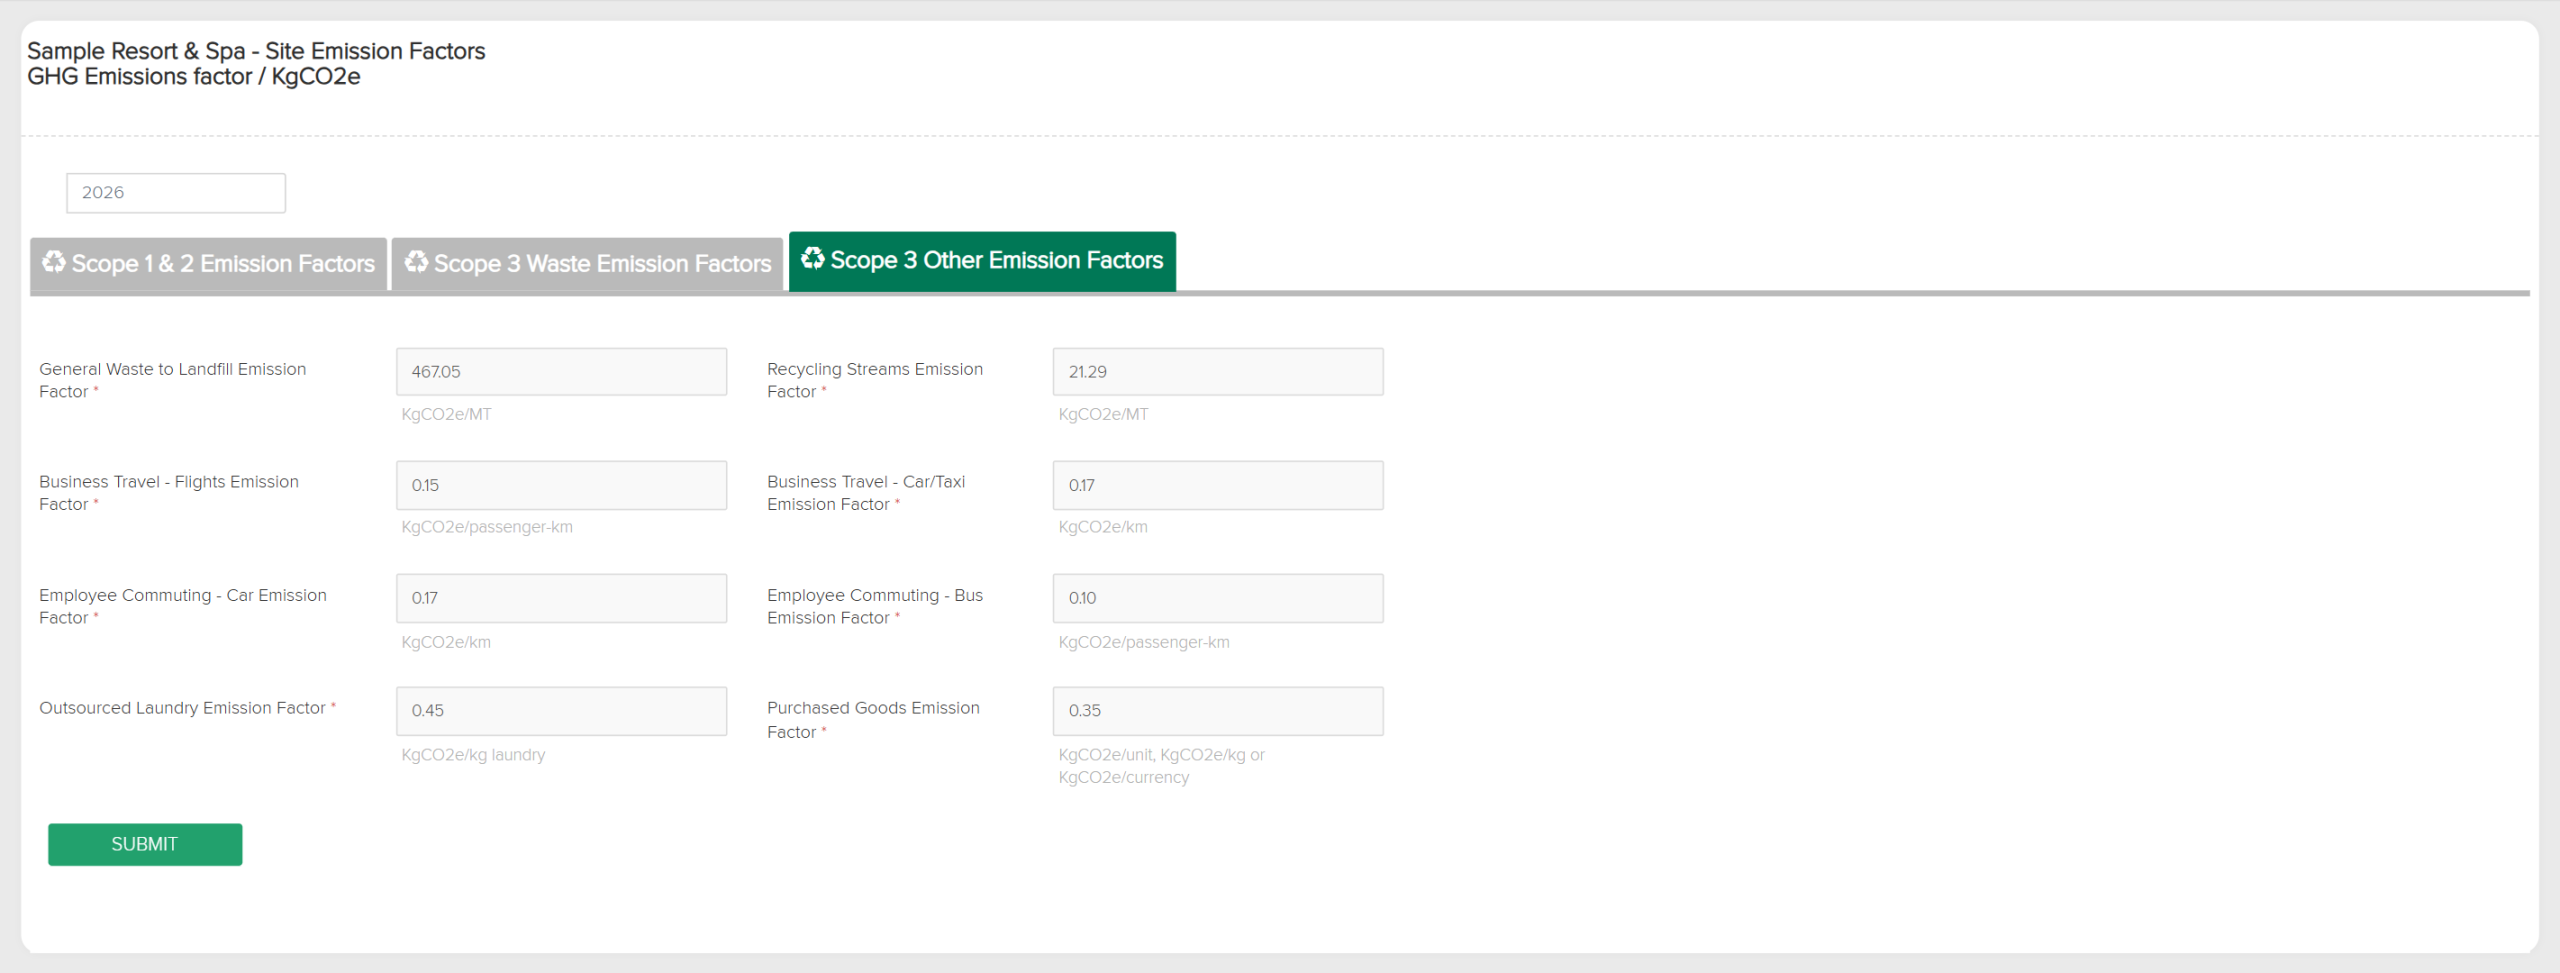
- Scope 3 value-chain emissionsalongside them, so the group carbon position is complete rather than partial.
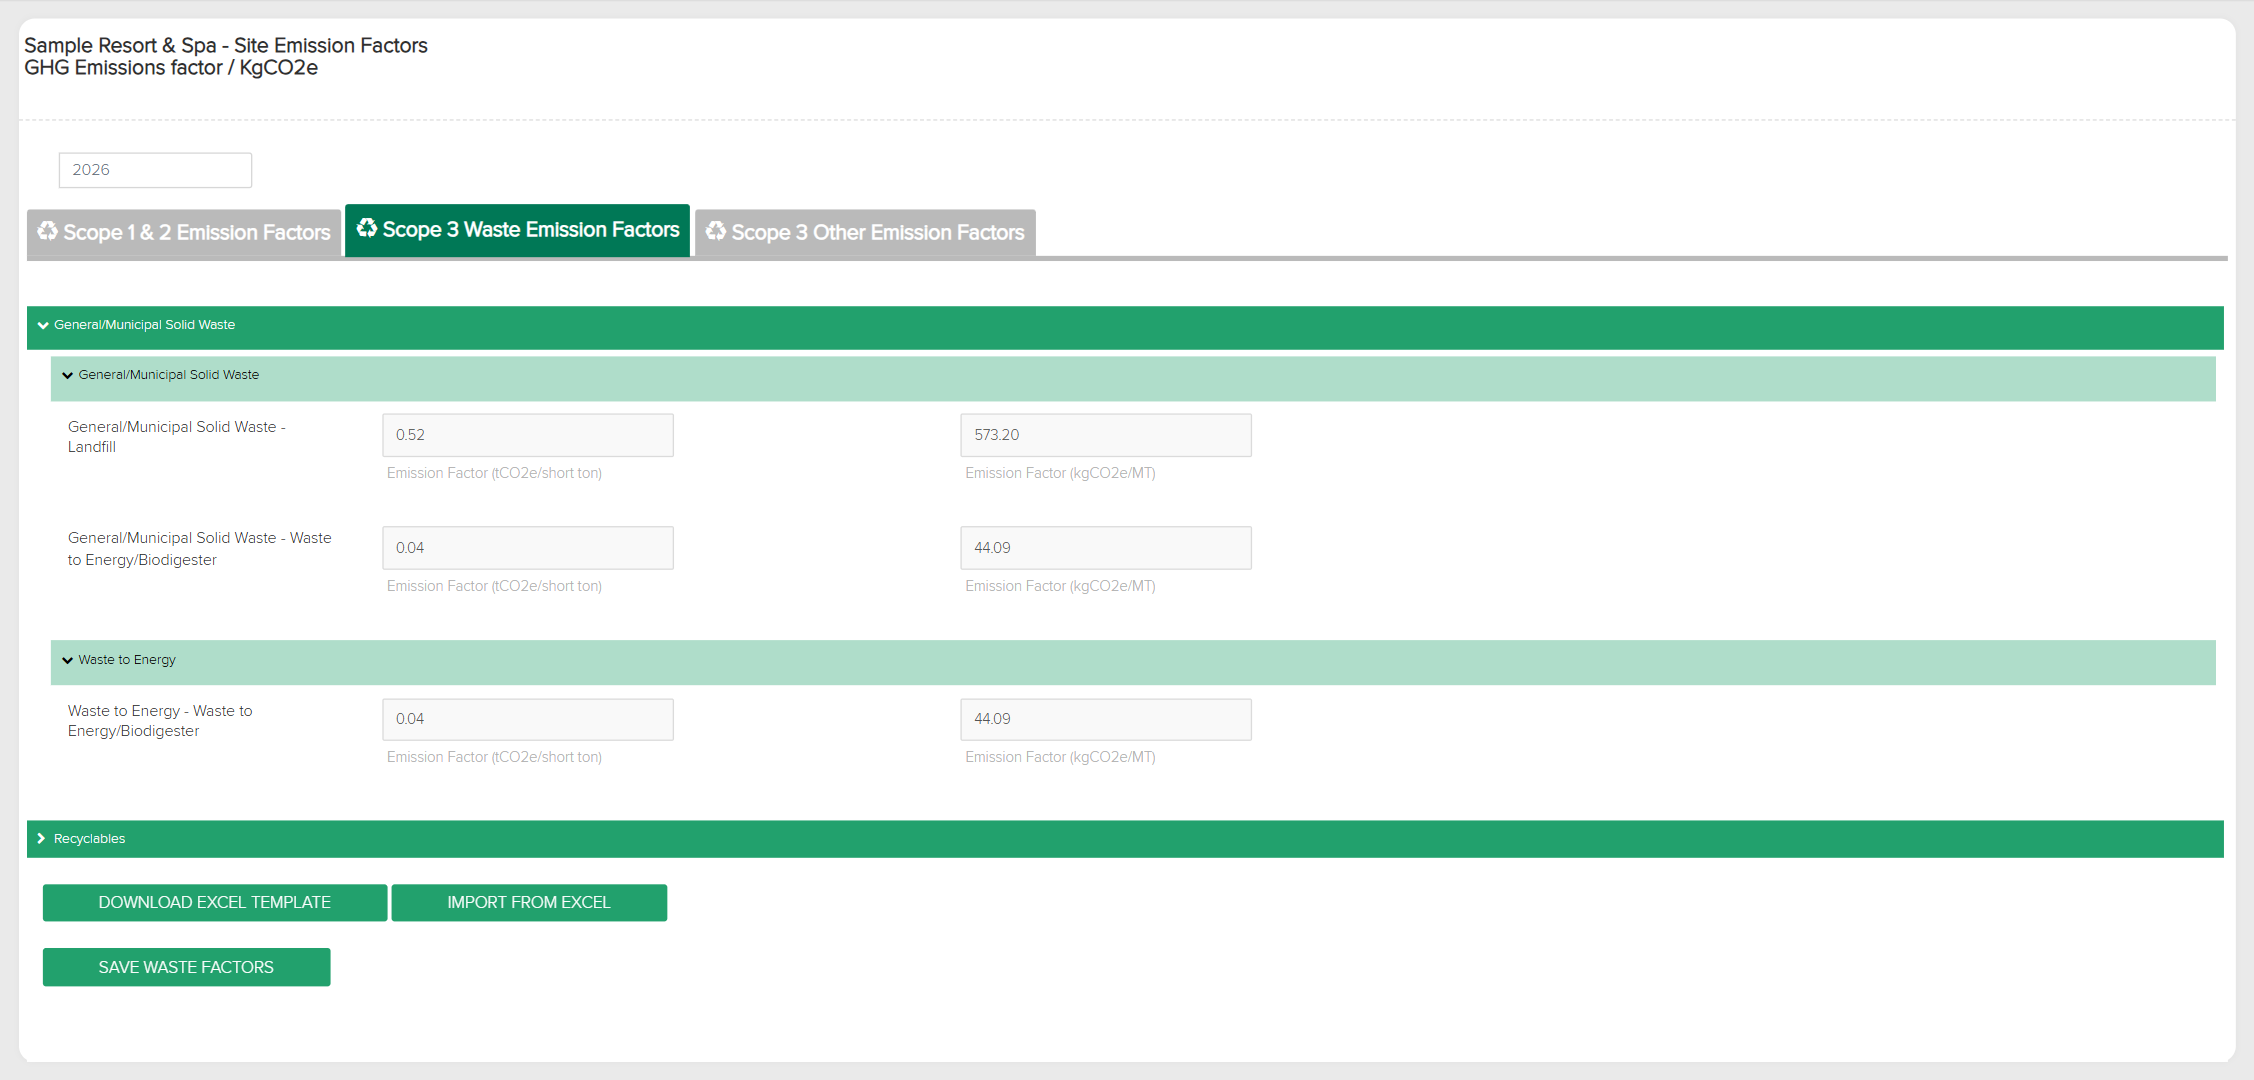
Three scopes, maintained yearly, visible in the portal.
Factors are held as a versioned yearly record rather than buried in a formula — which is what makes a carbon figure defensible when somebody asks where it came from.
Waste, in the same cycle as utilities
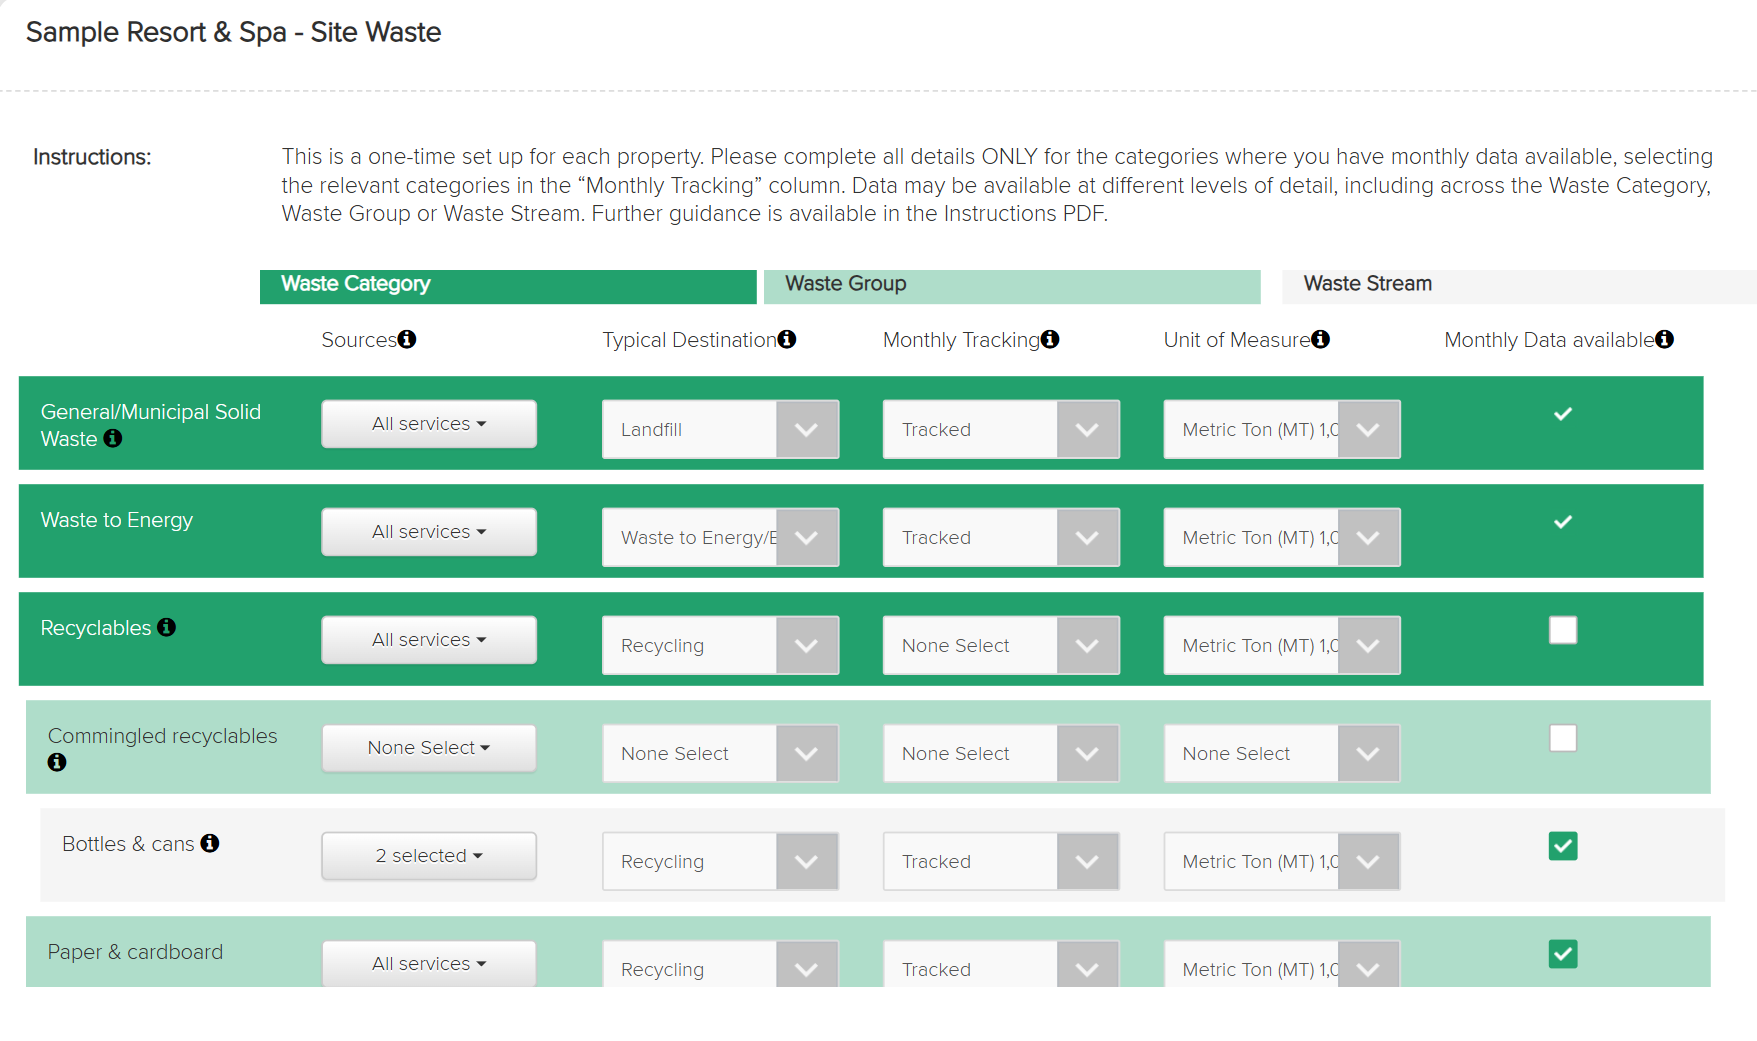
Waste Monthly is a structured import stream submitted alongside the utilities data, on the same monthly cycle the property already runs.
- Stream-level capture by volume and weight, with cost.
- Waste segregation reported as a sustainability indicator inside the total utilities reports.
- Trends month on month and year on year, with the last-uploaded month visible on the dashboard.
- Reduction targets set for waste alongside energy, carbon and water.
Sustainability & ESG survey
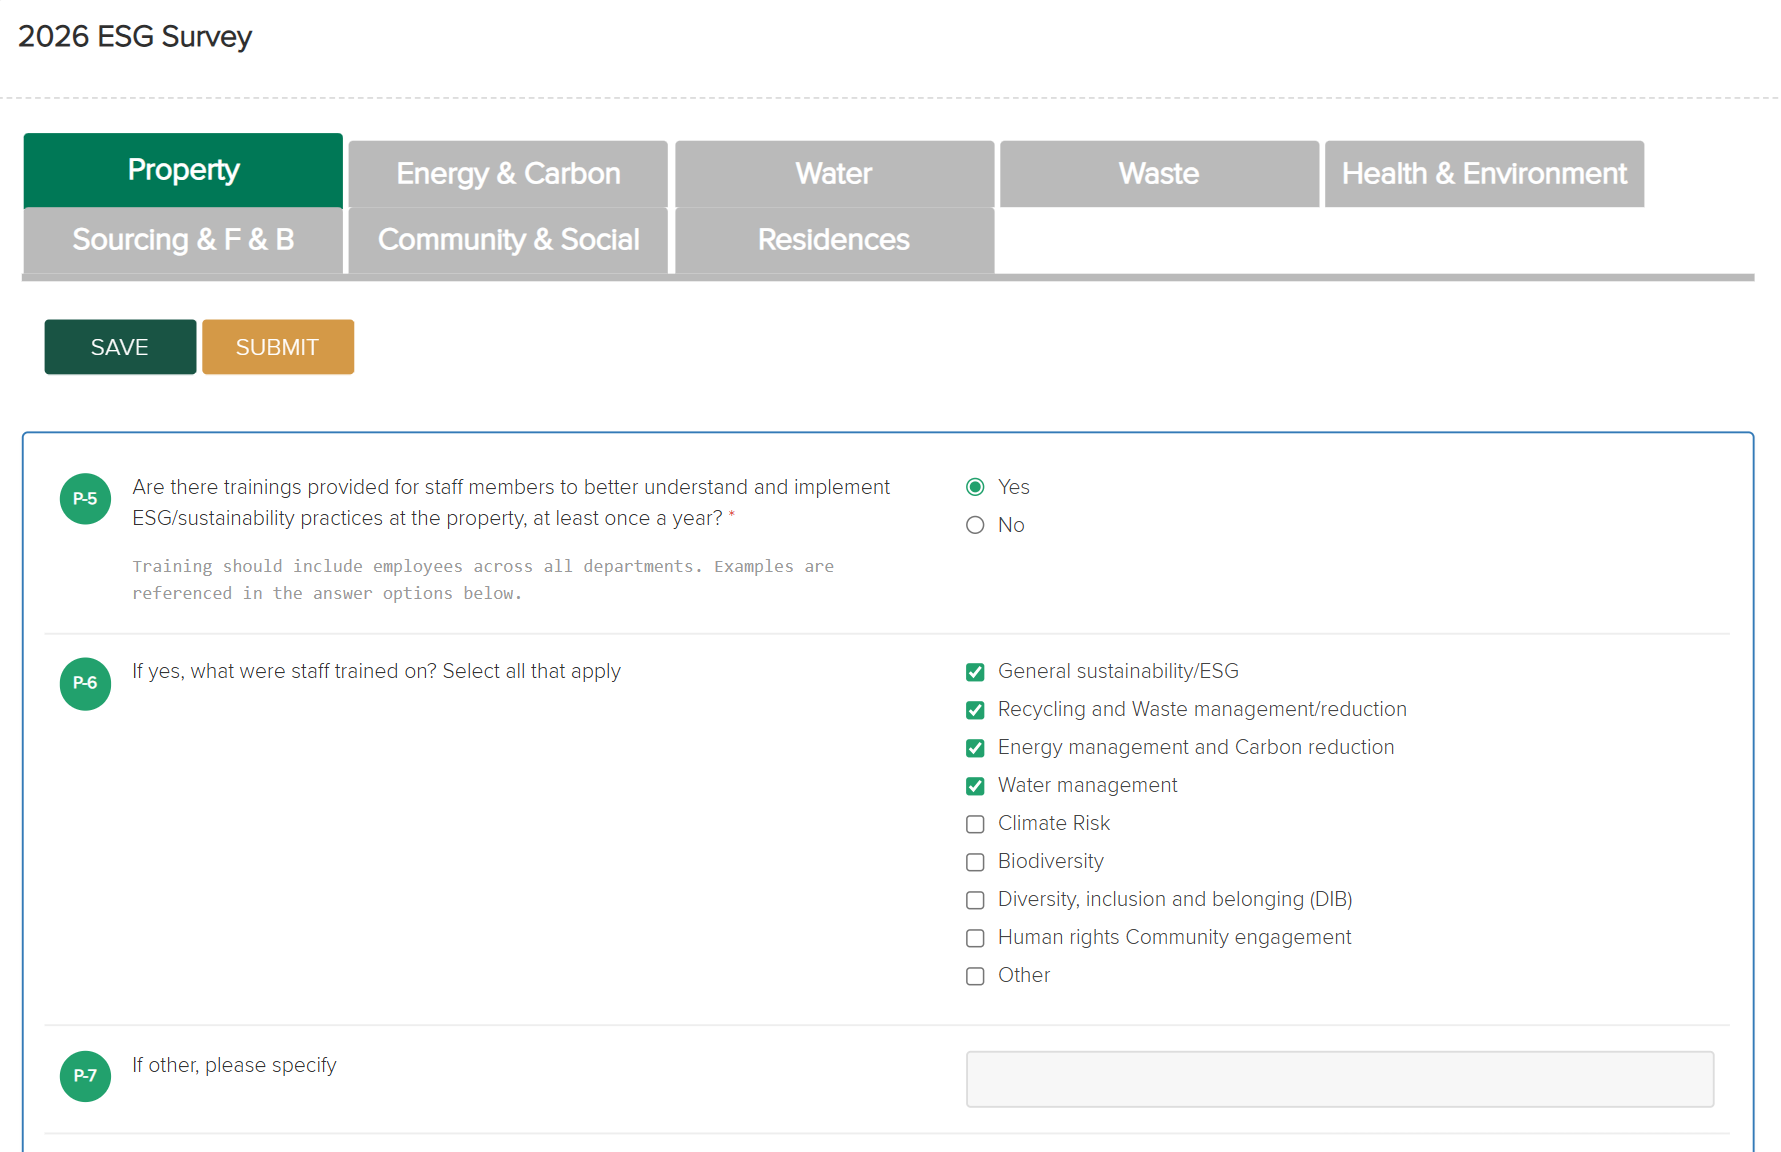
A configurable survey module covering the property's wider environmental and social position, with evidence captured against each topic and imported through its own data stream.
The eight topics
Survey Import is one of the five structured import streams, so responses and supporting evidence are versioned per property rather than emailed around as attachments.
Social and governance data, on its own cycle
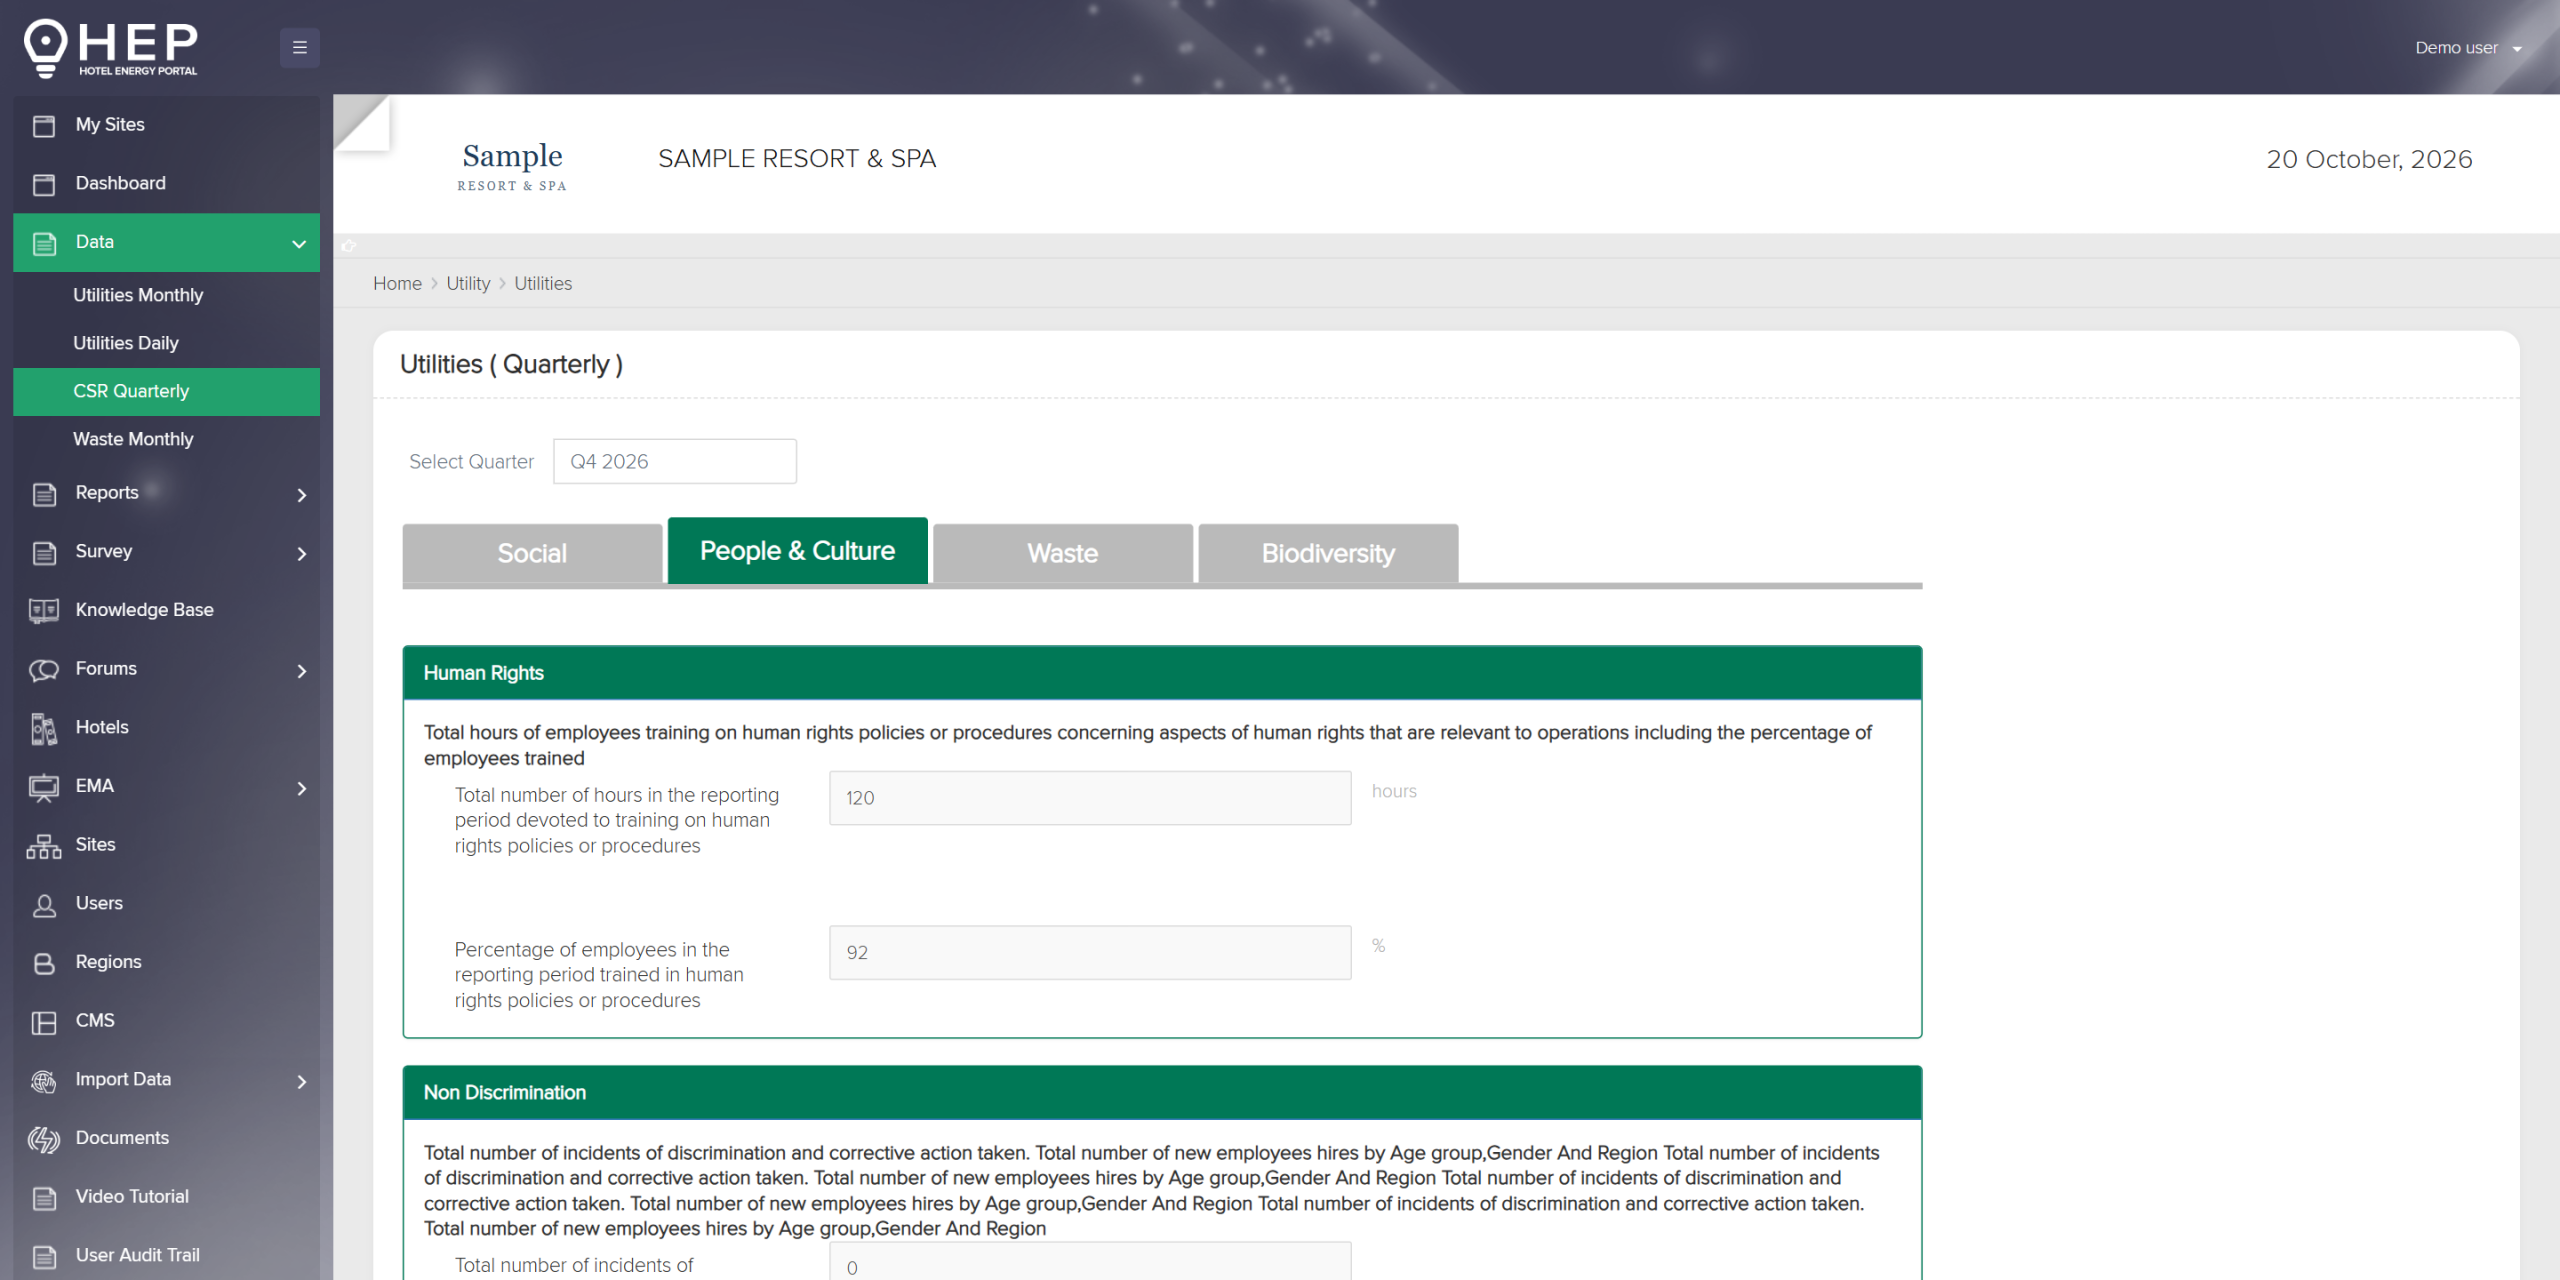
The annual survey sets the position. A quarterly return keeps the social and biodiversity data moving at the pace the reporting frameworks now expect.
- Human rights training — hours delivered in the period and the percentage of employees trained.
- Non-discrimination — incidents recorded, incidents reviewed, and remediation plans implemented.
- New hires by age group, gender and region, captured alongside them.
Every number on this page is tracked against a target.
Science-based reduction targets for energy, carbon, water and waste sit on the property dashboard — consumption and intensity year to date against target, with the reduction percentage and performance stated explicitly. Cornell CHSB benchmarking positions the result against the hospitality peer set.
See targeting & benchmarkingWhat's coming next.
Sustainability requirements are moving quickly, and this is where most of the current development effort goes. Scope 3 has already landed. The items below are in development and not available today — they are listed so you can plan around them, not buy on them.
Further ESG capability
Additional sustainability and ESG features are being built behind the carbon work. The intent is the same as everything else in HEP: derive it from data the properties are already submitting rather than adding a separate collection exercise.
Client requirements shape the order
If your reporting obligations require something specific, tell us during the demo. Hotel groups facing the same deadline usually need the same thing, and that is what determines what gets built next.
Anything described elsewhere on this site is live in the portal today. Roadmap items appear only in blocks marked like these.
About sustainability reporting
Where does the carbon number come from?
From your own consumption. HEP applies emission factors, maintained yearly per location, to the utility data already in the portal — so the carbon figure and the energy figure cannot disagree, and there is no reconciliation step between them.
Which scopes are covered?
Scope 1, Scope 2 and Scope 3. Scopes 1 and 2 are calculated from your consumption, using emission factors maintained yearly per location. Scope 3 covers the value-chain emissions around them, such as waste, and all three are tracked in the portal alongside your utilities.
Is waste in the same cycle as utilities?
Yes. Waste Monthly is a structured import stream submitted alongside the utilities data, and waste segregation appears as an indicator in the total utilities reports.
Can we set reduction targets?
Yes, for energy, carbon, water and waste. Consumption and intensity are tracked against target year to date on the property dashboard, with the reduction target percentage and performance stated explicitly. See targeting & benchmarking.
See your carbon calculated from your own meters.
Send us one property's utility history and we will run it through.
Request a demo